

Lorem Ipsum is simply dummy text of the printing and typesetting industry. Lorem Ipsum has been the industry’s standard dummy text ever since the 1500s, when an unknown printer took a galley of type and scrambled it to make a type specimen book. It has survived not only five centuries, but also the leap into electronic typesetting, remaining essentially unchanged.
I am text block. Click edit button to change this text. Lorem ipsum dolor sit amet, consectetur adipiscing elit. Ut elit tellus, luctus nec ullamcorper mattis, pulvinar dapibus leo.
-
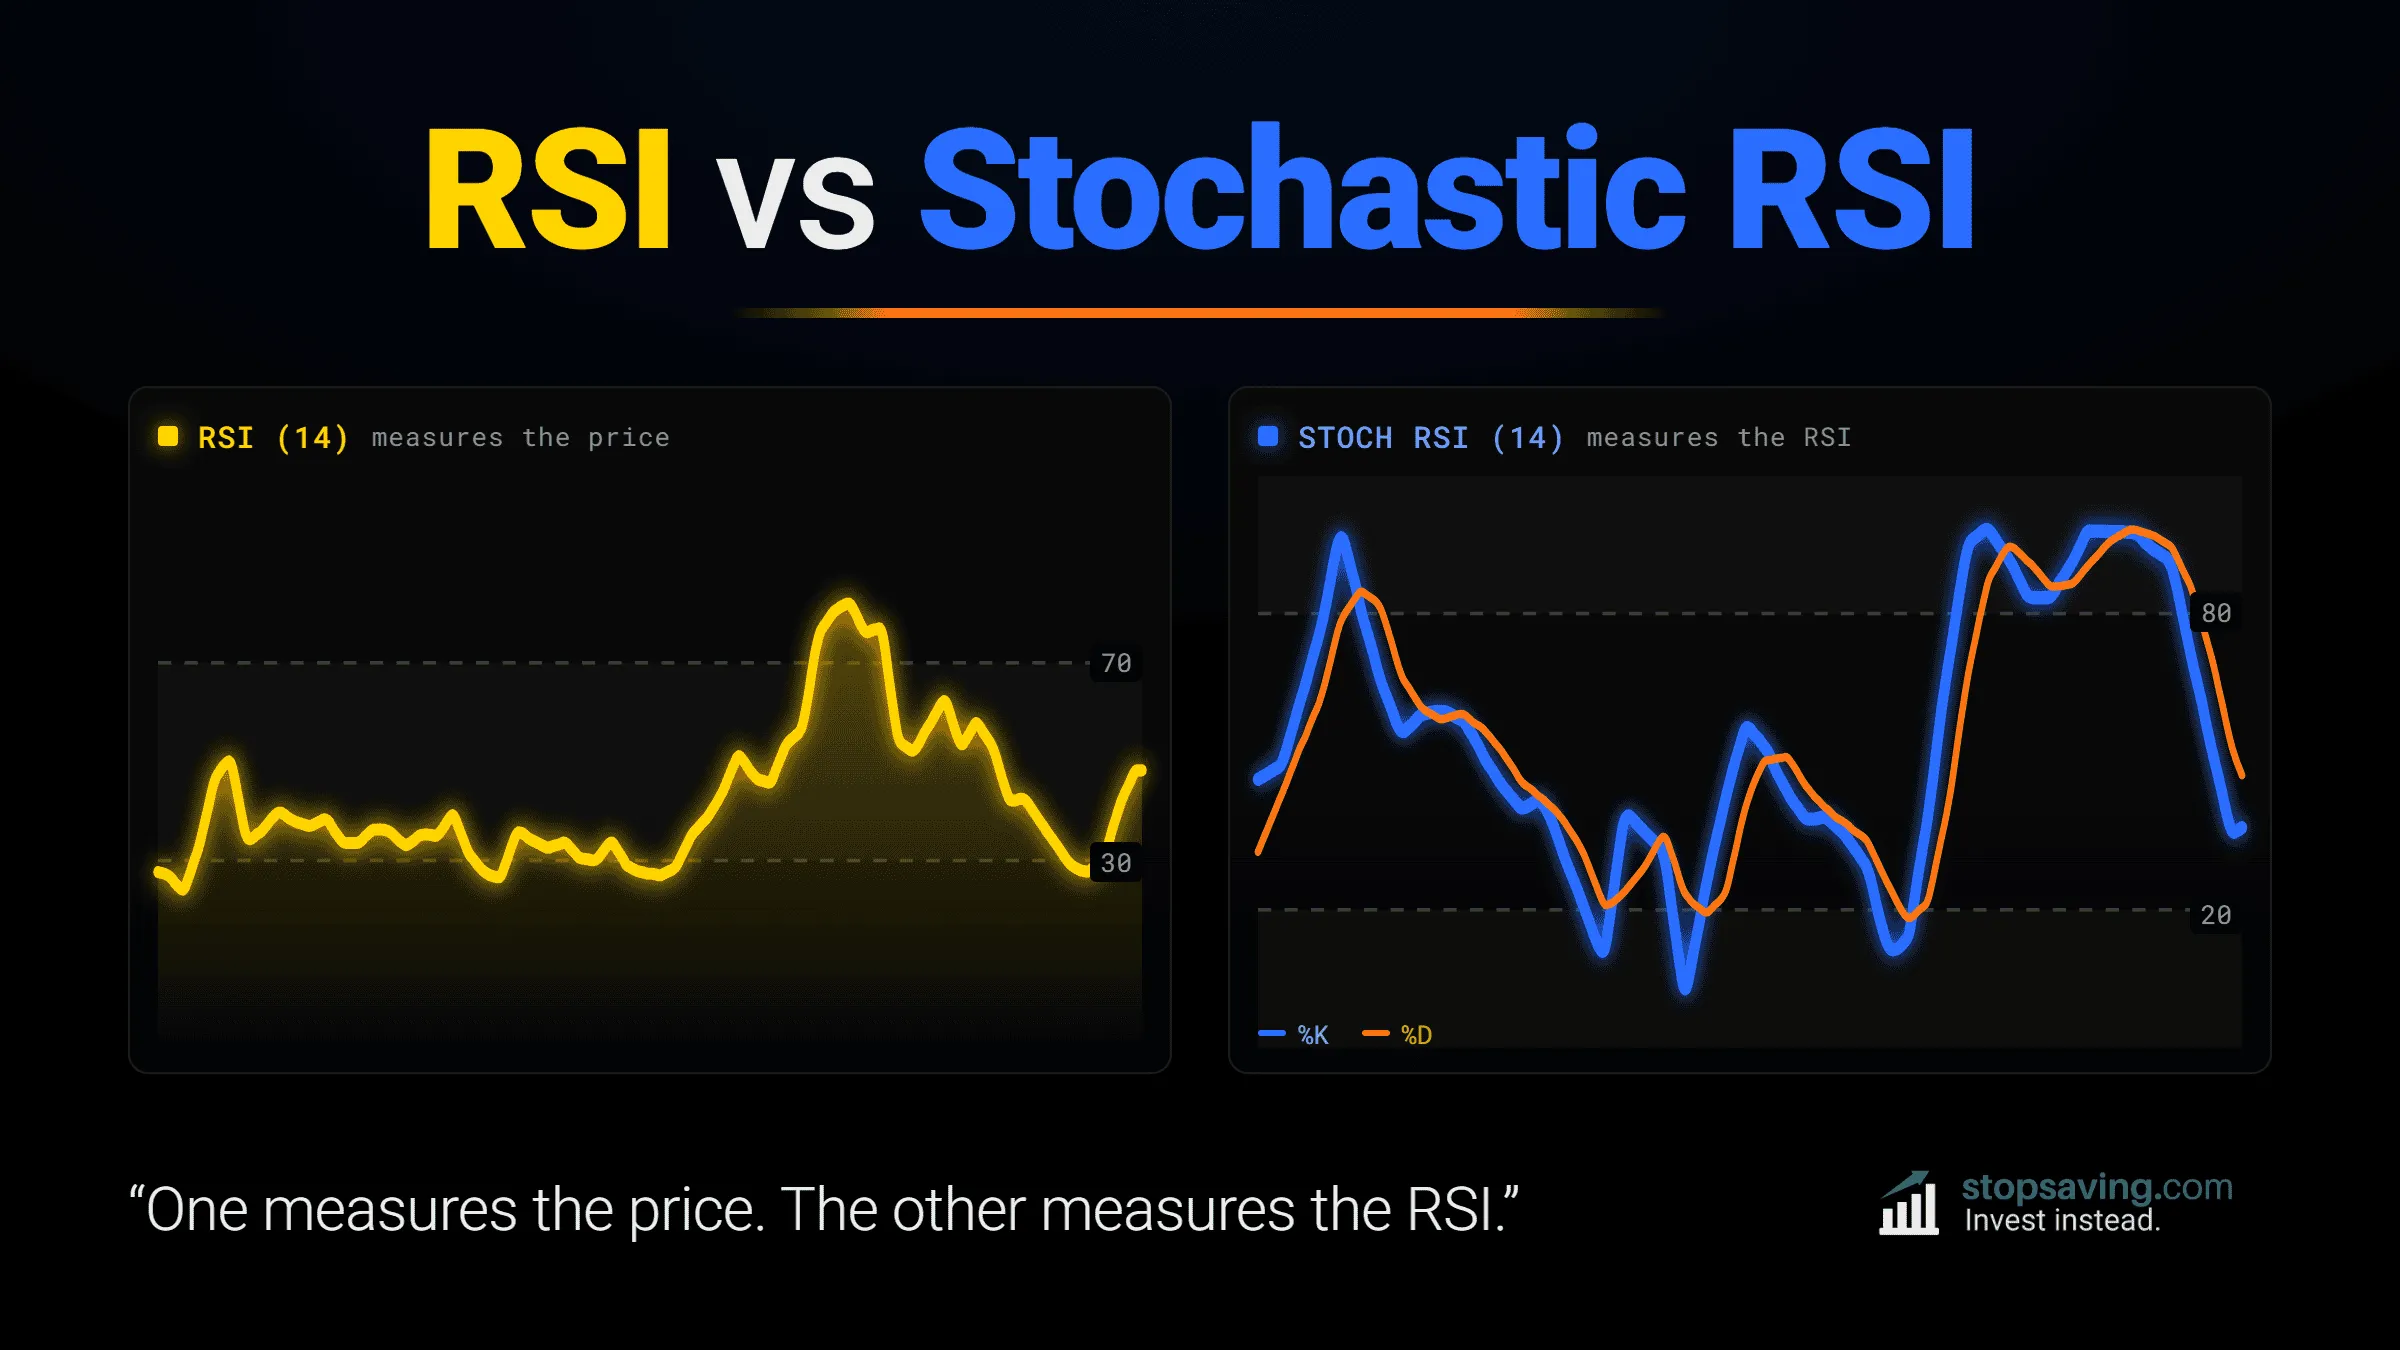
RSI vs Stochastic RSI: Which Should You Use?

The relative strength index (RSI) measures the momentum of an investment’s price. The Stochastic RSI measures the momentum of the RSI itself. That one difference decides everything else.
Momentum is how much strength is behind a price move. The RSI tracks it slowly and steadily. The Stochastic RSI exaggerates every twitch in the RSI – so it tends to swing between extremes more often, with more false alarms.
Here’s how the two indicators compare, and how to choose the right one for your trading or investment strategy.
-
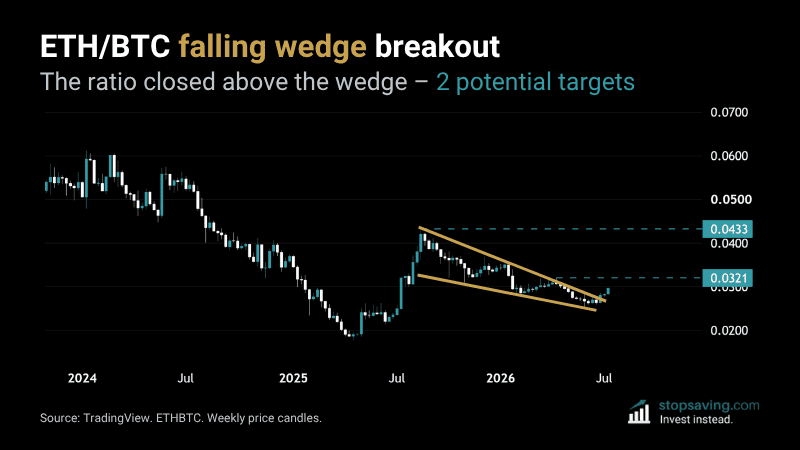
ETH/BTC Falling Wedge Breakout: 2 Targets for the Ratio

The ETH/BTC ratio measures how much bitcoin one Ethereum is worth. Right now it’s just under 0.03 – meaning one ETH buys you nearly 0.03 BTC. When the ratio rises, Ethereum is beating bitcoin. When it falls, bitcoin is winning. And for the past year, bitcoin was winning inside a pattern called a falling wedge. Last week, that pattern broke – in Ethereum’s favor.
-
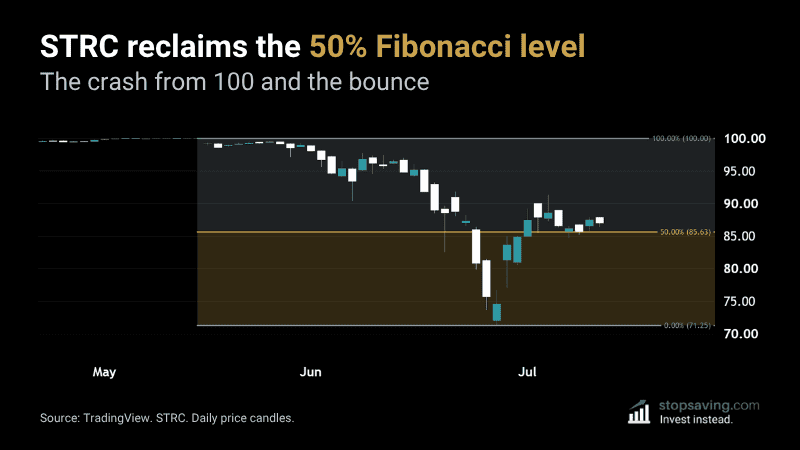
STRC Stock Reclaims the 50% Fibonacci After Crashing
When a price recovers half of a big crash, traders take note. That halfway point is the 50% Fibonacci level – and Strategy’s STRC preferred stock has now reclaimed it. Here’s what this thing is, why it crashed, and what to watch now.
-
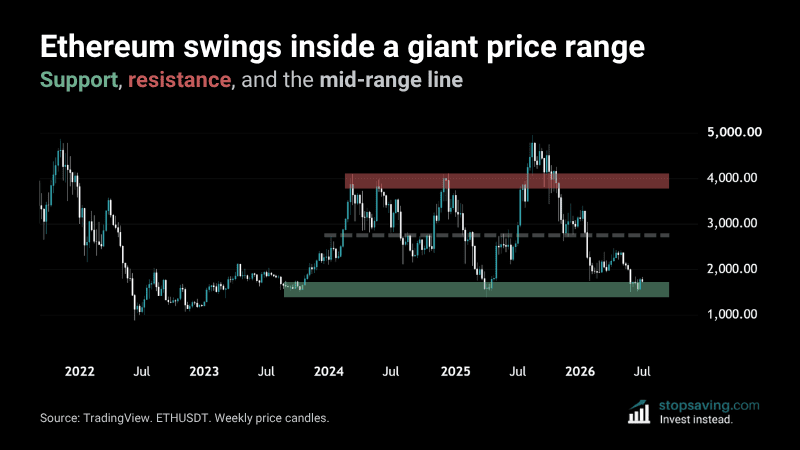
ETH Price Range: 3 Levels for Ethereum Swing Traders
Investors who bought and held Ethereum over the past few years have mostly lost money. But Ethereum swing traders have had plenty to write home about. ETH hasn’t really seen a sustained uptrend since the 2020/2021 bull market. Instead, it’s traded in a wide range – with big rallies and big drops. According to this chart, ETH is at the bottom of that range now.
-
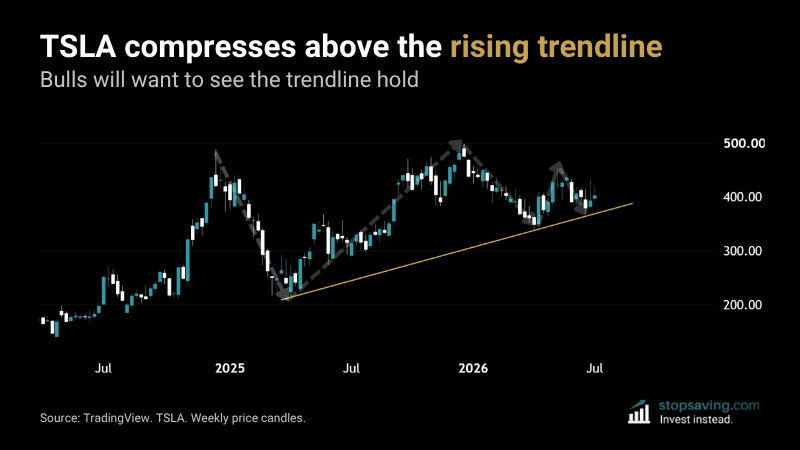
Tesla Stock (TSLA) Is “Safe” – if This Trendline Holds
A rising trendline tells you buyers are getting impatient – every dip gets bought at a higher price than the last. Tesla stock (TSLA) has bounced off the same rising line on the weekly chart for over a year.
-
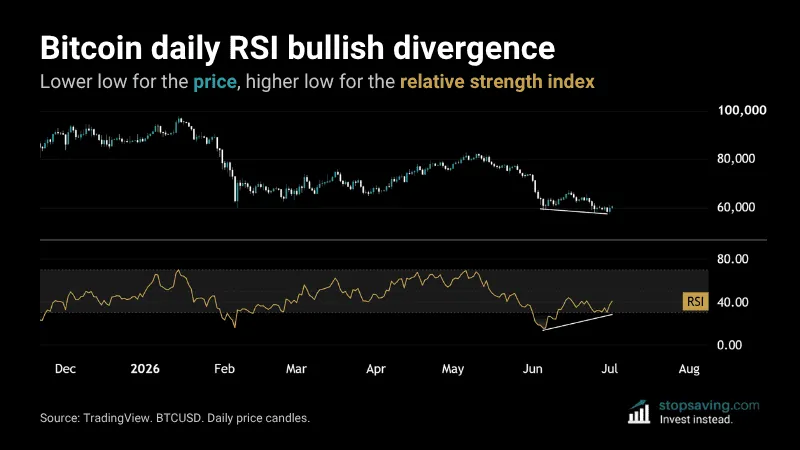
Bitcoin RSI Bullish Divergence Builds the Bottom Case
A bullish RSI divergence signals that sellers are losing power – even while the price keeps drifting lower. Bitcoin’s daily chart just made one. The price dropped to $59,081 on June 5, then made a lower low of $57,737 on July 1. But the RSI did the opposite: it made a higher low in that time.
-
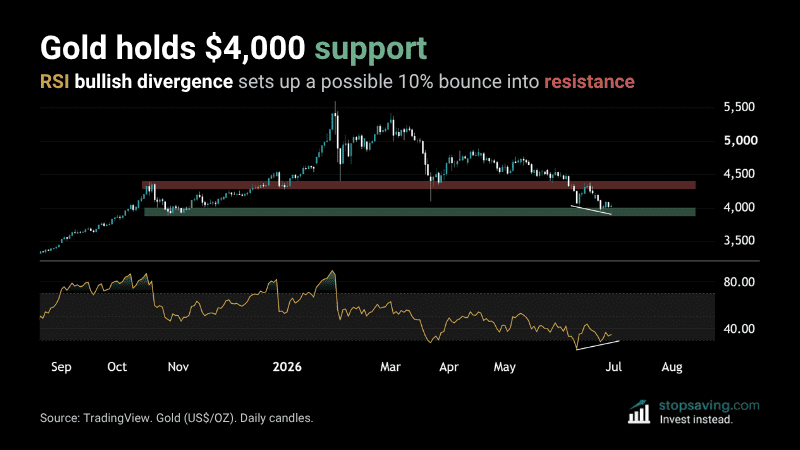
Gold Bounce Incoming? 3 Reasons Not to Short $4,000
The gold price has trended down since January. But at around $4,000 per ounce today, this is a poor spot to short. Here are three reasons why a 10% bounce could be fair game.
-
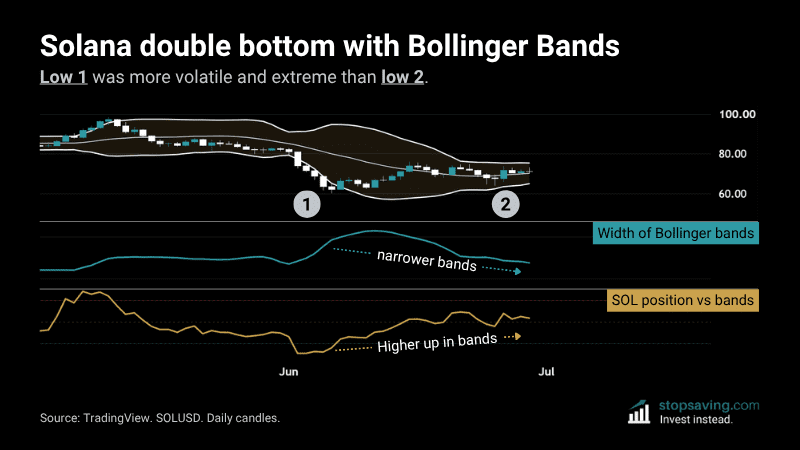
Solana Double Bottom With Bollinger Bands
Solana (SOL) has made a double bottom pattern, with two major lows in June. The first low was on June 6 at $60.12 per SOL (SOLUSD, TradingView). The second low came on June 25 at $63.97 – higher than the first. Throw some Bollinger Band analysis around these two lows, and there could be more upside for SOL.
Here’s how the trade setup works – and how to know if it doesn’t.
-
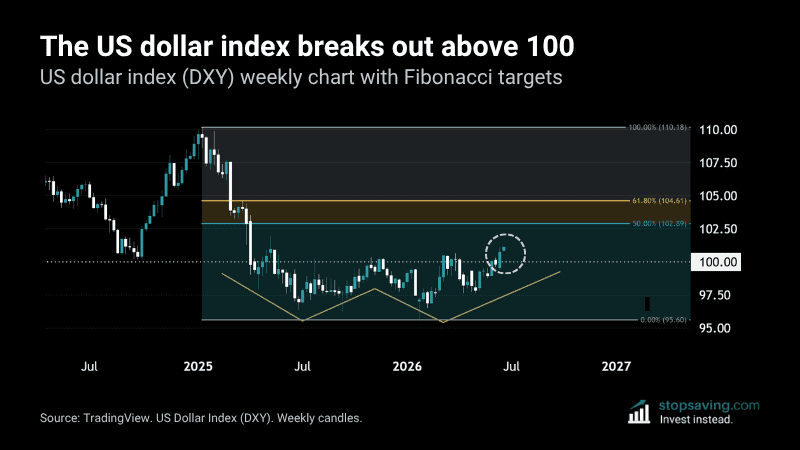
The Dollar (DXY) Breakout – What It Means for US Stocks
The US dollar index (DXY) has broken out above 100. It closed last week at 100.76 and now trades around 101. Two weeks ago, I said the DXY needed to reclaim 100 to confirm its Wyckoff accumulation pattern. That’s now playing out – meaning the dollar could strengthen versus other major currencies.
-
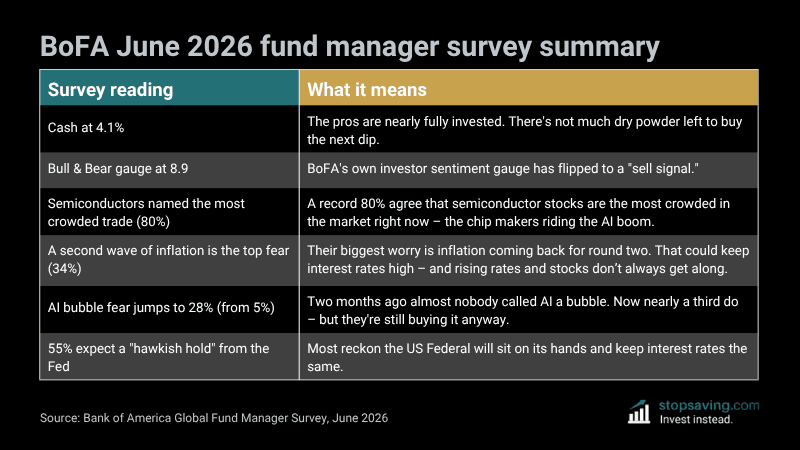
Fund Managers Are All-In on Stocks (Bank of America Survey)
Institutional investors are nearly all-in on stocks, according to Bank of America’s June Global Fund Manager Survey. Its main sentiment gauge has even flashed a “sell signal” – a level that’s lined up with past market tops. It seems the pros are all-in on stocks, but should you be too?
-
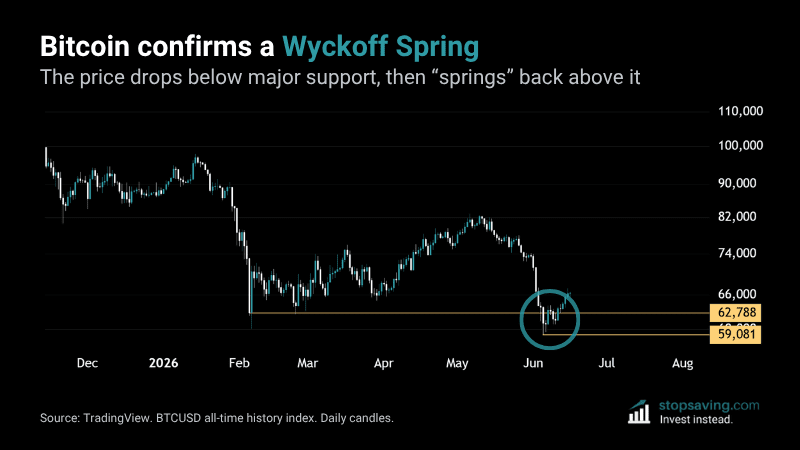
Bitcoin Just Confirmed a Classic Wyckoff Spring
Bitcoin just confirmed a classic Wyckoff Spring – something you typically only see at major market bottoms. First, the price lost a huge support level that buyers had held for four months. It then spent a few days below that support, before “springing” back above the line. Here’s what it means for bitcoin, and what to look out for to keep the bull case intact.
-
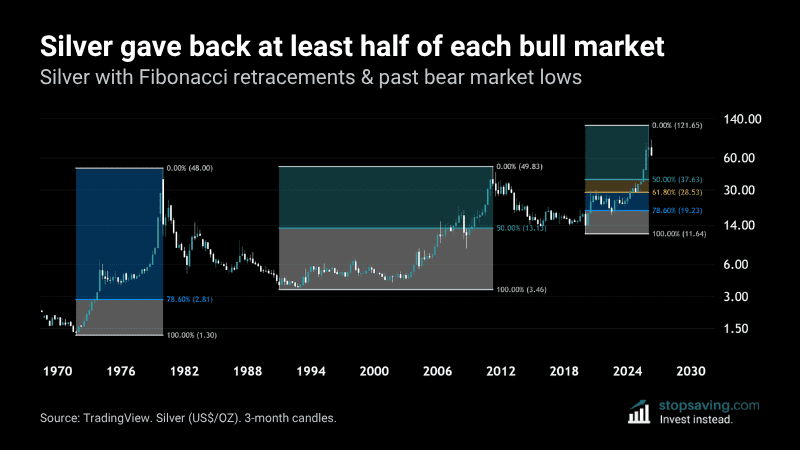
How Low Can Silver Go? Bear Market Fibonacci Targets
Silver could have a long way to fall if its bull market is done. Over the past 50 years, silver has given back at least half of every parabolic run – and in 1980 it gave back almost three-quarters. If you run those retracements on the current cycle, the downside zone is somewhere between $37.63 and $19.23.
-
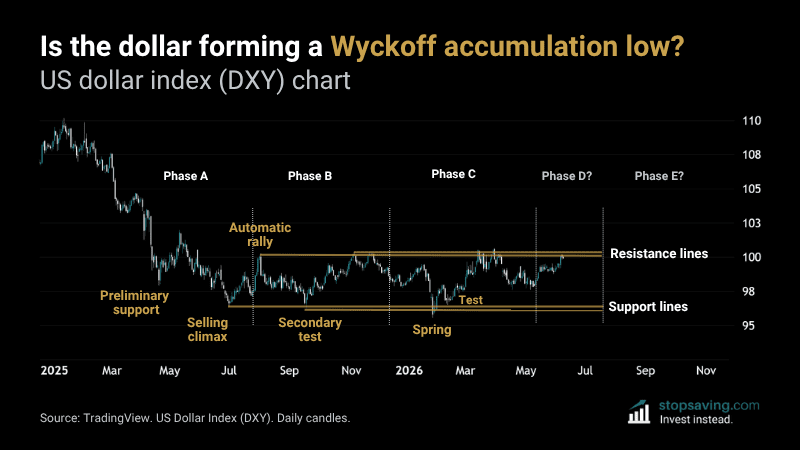
Is the Dollar (DXY) Forming a Wyckoff Accumulation Low?
If you’re a fan of the Wyckoff method, you’ll want to pay close attention to this chart. It shows how the US dollar index (DXY, TradingView) has traded in a sideways range for over a year. And the shape of that range looks eerily similar to a Wyckoff accumulation pattern. If the pattern plays out, it would suggest the US dollar could be finding a major low. And it could get a lot stronger versus other currencies in the coming months.
-
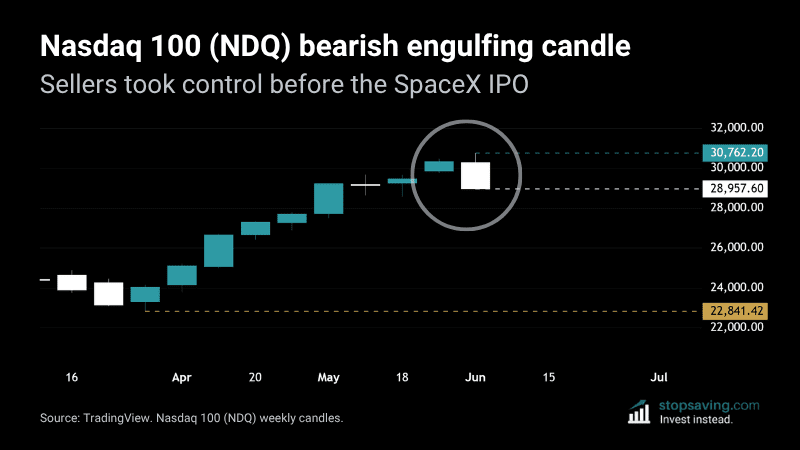
Nasdaq Bearish Engulfing Candle Meets the SpaceX IPO
The Nasdaq 100 index just closed the week with a bearish engulfing candle. The index – which is a proxy for US tech stocks – is down nearly 6% from its June 3 high of 30,762.20 points. And the timing is interesting: Elon Musk’s SpaceX will list on the US stock market next week. It will be the biggest initial public offering (IPO) of shares in market history.
-
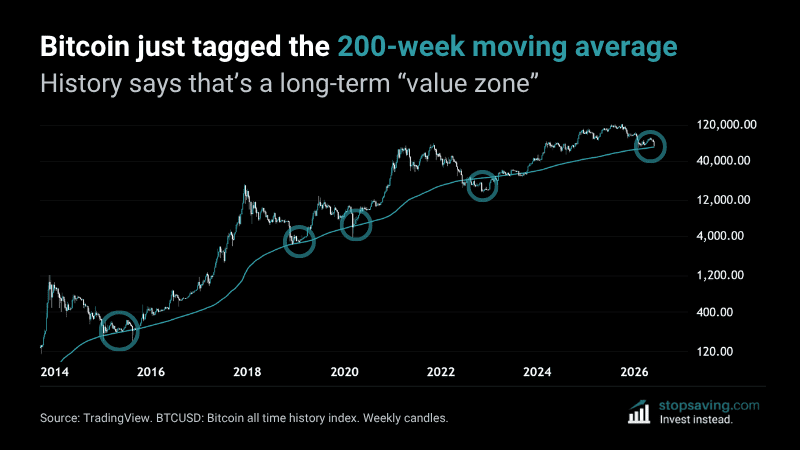
Bitcoin Just Tagged the 200-Week Moving Average “Value Zone”
Bitcoin just tagged its 200-week moving average – a line with a serious track record. It’s been “close enough” to every major bitcoin bottom since 2015. In hindsight, each touch was a long-term value zone for bitcoin buyers to dollar-cost average in.
-
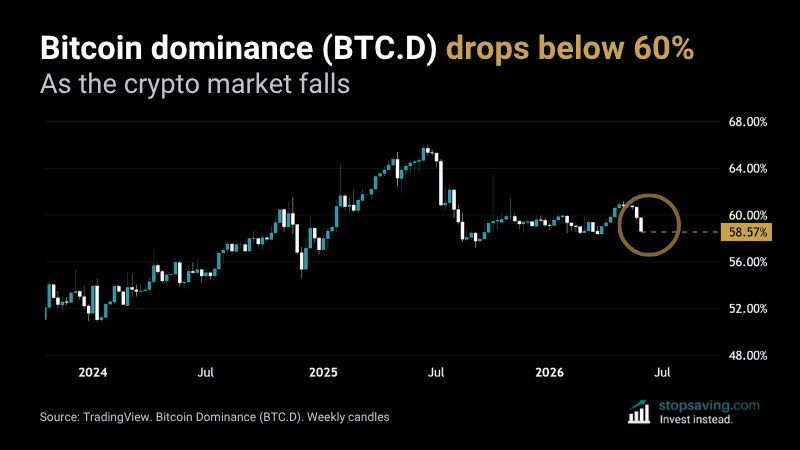
Bitcoin Dominance (BTC.D) Dropped on the Crypto Dip
Bitcoin dominance (BTC.D, TradingView) dropped over the past week, even as the crypto market sold off. That’s a bit unusual: when crypto falls, dominance often rises – because investors see it as “safer” than most altcoins. This time bitcoin fell more than the general market.
-
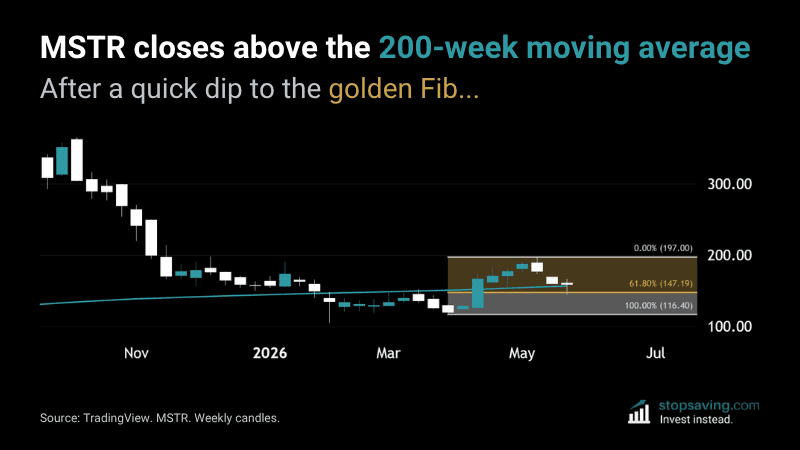
Has MicroStrategy’s 200-Week MA Flipped Bullish?
MicroStrategy stock (aka Strategy, MSTR) did something interesting last week: it held the 200-week moving average as price support. After bouncing at the 61.8% “golden” Fibonacci ratio on Thursday, the stock closed Friday above the moving average.
-
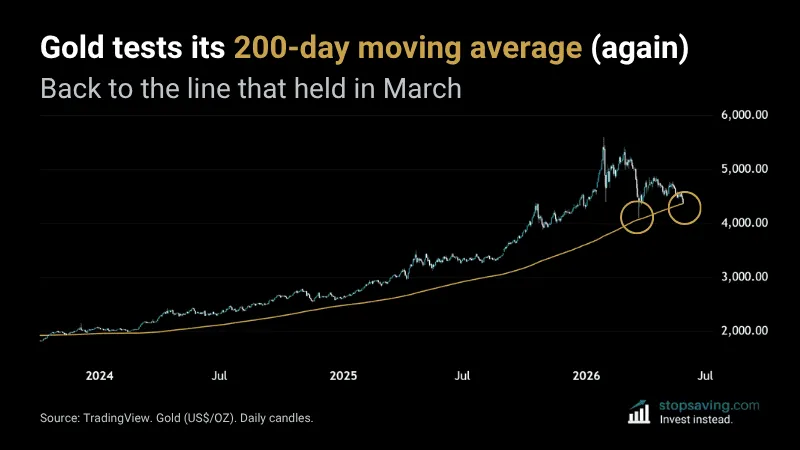
Gold Tests Its 200-Day Moving Average (Again)
About a month ago, I wrote about three bearish signals for gold. The price has fallen since then. Gold is now trading back at its 200-day moving average – the same line it bounced off hard in March.
-
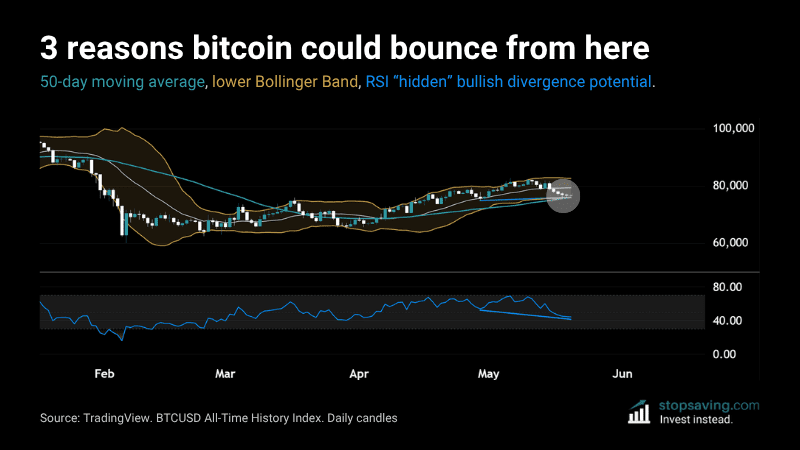
3 Reasons Bitcoin Could Bounce From Here
After hitting $82,000 per coin in early May, bitcoin has since fallen about 8%. Is this the start of a bigger drop, or are there reasons to believe the pullback could be over? This chart shows three reasons why bitcoin could be setting up for a bounce.
-
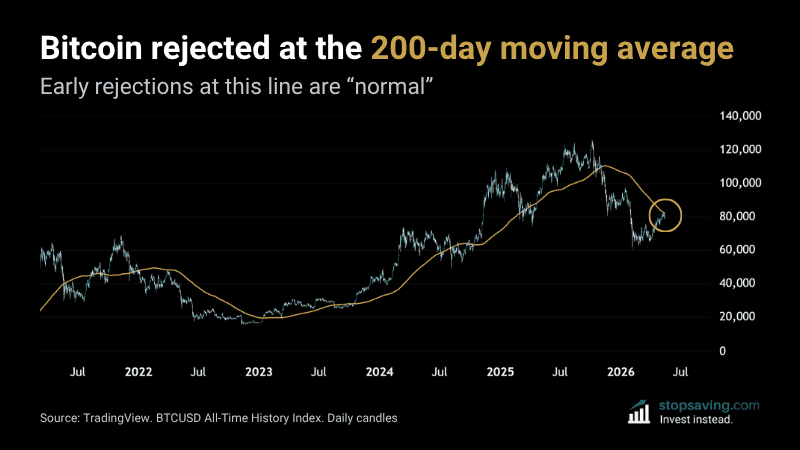
Bitcoin Rejected at the 200-Day Moving Average – That’s OK
Bitcoin has rallied 37.72% off the 6 February low. The rally hit its peak on 6 May and got rejected just below the 200-day moving average. Bitcoin tried to break the moving average again on 10 May and got rejected again. The line is now acting as resistance at around 82,000. Early rejections at this level are normal. They can also set up something more interesting.
-
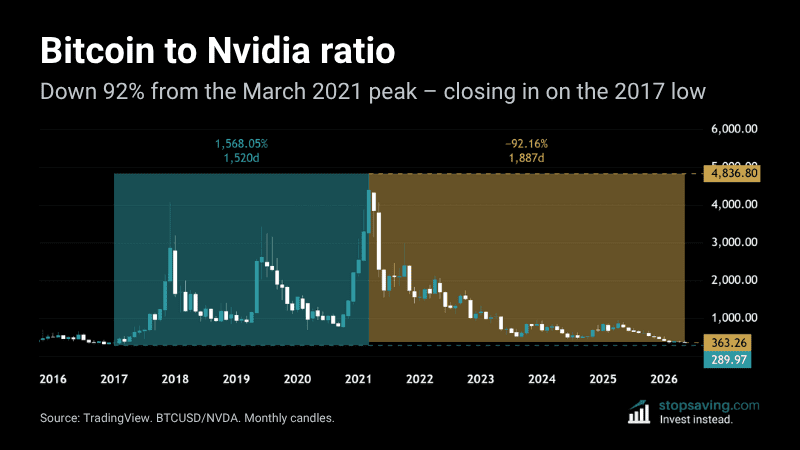
Bitcoin vs Nvidia: BTC/NVDA Ratio Down 92% Since 2021 Peak
Bitcoin is down 92% against Nvidia since the BTC/NVDA ratio peaked at 4,836.8 in March 2021. The ratio is now around 360 – closing in on its January 2017 low of about 290. Bitcoin has all but round-tripped its earlier gains over the tech stock.
-
SUI Reclaims 20-Week Moving Average After 29 Weeks Below
SUI closed back above its 20-week moving average last Sunday – for the first time since October 2025. It spent 29 weeks under the line before that – the longest stretch in SUI’s short trading history. The only other long run below was 18 weeks back in 2024. After SUI reclaimed the line that time, the price rose about sixfold over the next three months.
-
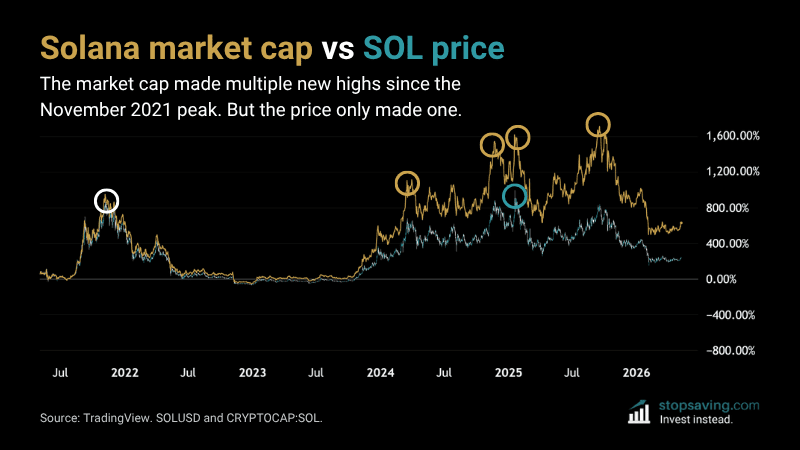
Solana Market Cap vs SOL Price: A Lesson In Token Dilution
Solana’s market cap has made multiple new highs since the November 2021 bull market peak. But the Solana token price (SOL) has only made one – beating its 2021 high by about 14%. The reason is token dilution: Solana’s supply keeps growing, so each token owns a smaller slice of the pie.
-
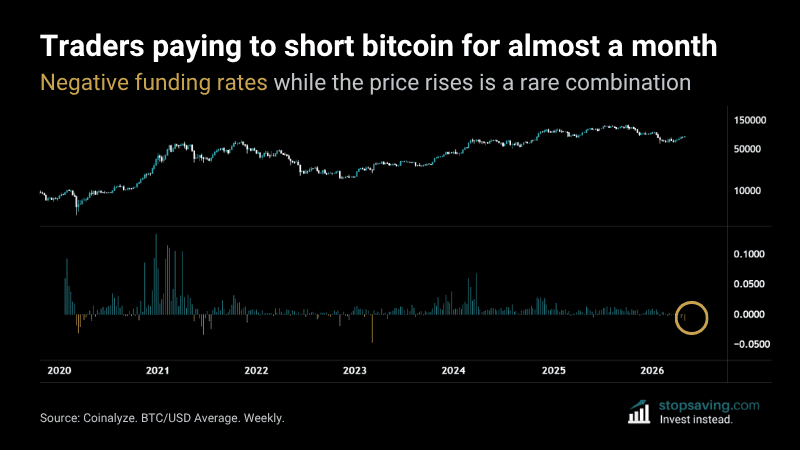
Traders Pay to Short Bitcoin (Negative Funding Rates)
Since the week of 13 April 2026, traders have been paying fees to short bitcoin using perpetual swaps. Over the same time, the bitcoin price has risen by about 15%. That’s nearly a month of negative funding rates during a recovery rally – and that doesn’t happen very often.
-
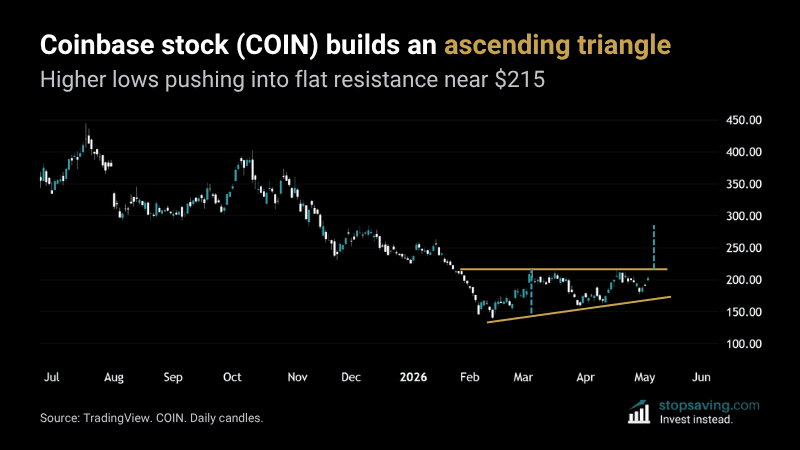
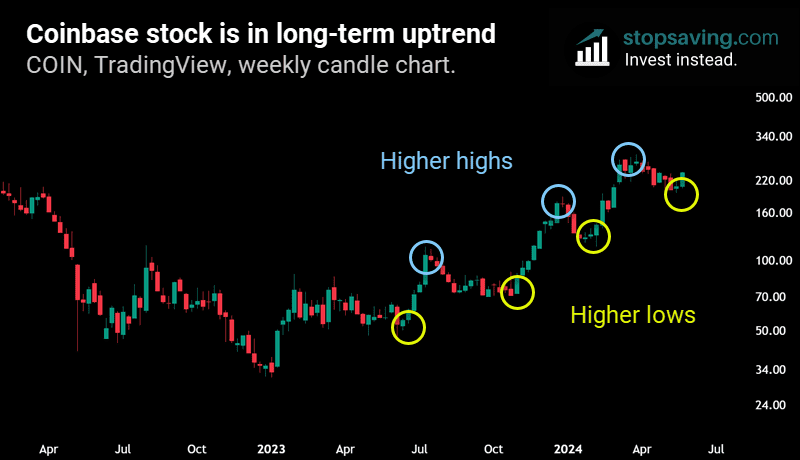
Coinbase Stock (COIN) Builds an Ascending Triangle
Buyers have shown up at higher and higher prices since February, but sellers keep capping the move at around $215. Here’s an ascending triangle pattern on Coinbase stock – and the resolution might come on Thursday when the company reports earnings.
-
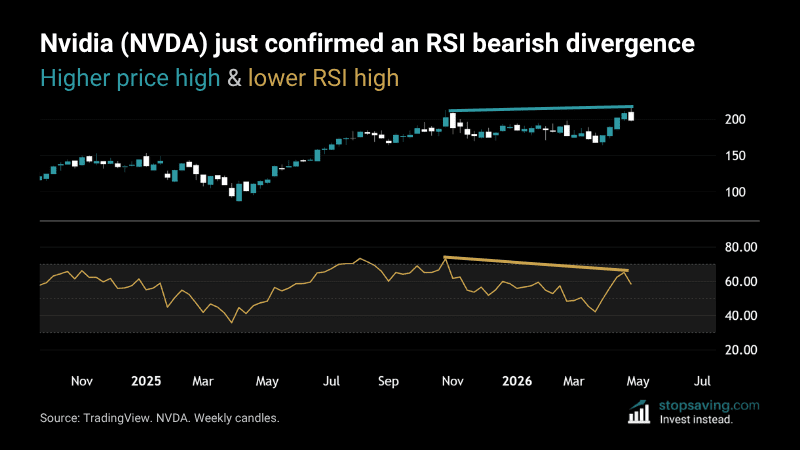
Nvidia (NVDA) Just Confirmed an RSI Bearish Divergence
Nvidia’s weekly chart just confirmed a bearish divergence between the price and the relative strength index (RSI). The price made a new high in April 2026 – above its October peak. But the RSI didn’t follow – it made a lower high. If you’re going strictly by the technical analysis book, last week’s bearish engulfing candle was the “confirmation” of that top. And the confirmation of the RSI bearish divergence.
-
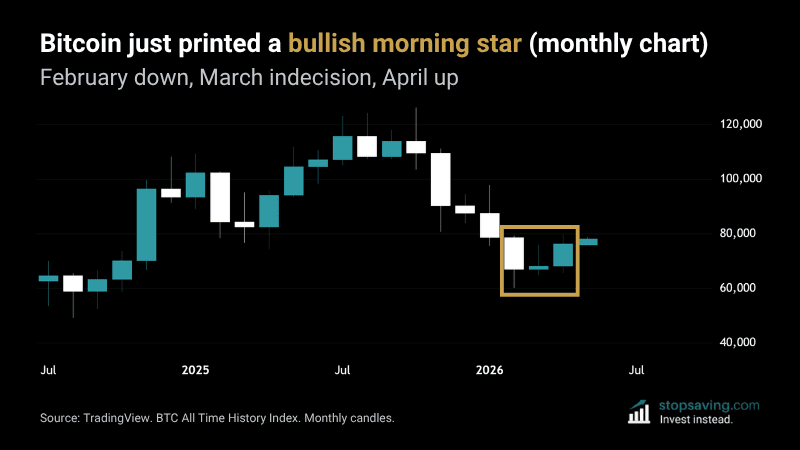
Bitcoin Just Printed a Bullish Morning Star (Monthly)
Bitcoin’s monthly chart just printed a textbook bullish morning star candle sequence. February closed deep in the red at $66,993.86. March was a small indecision candle, closing at $68,226.39. April closed strong in the green at $76,318.70.
Three months, three candles, and one of the cleanest reversal patterns you can ask for on a monthly chart.
-
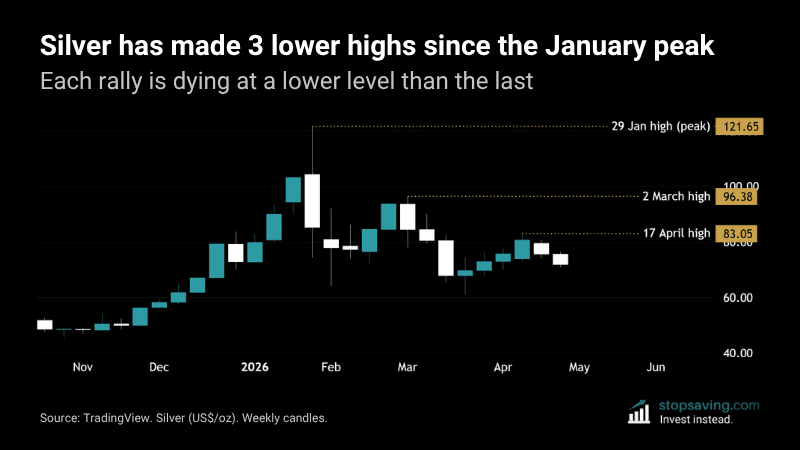
Has Silver’s Bubble Popped? 3 Lower Highs and Counting
Silver peaked at $121.65 on 29 January 2026 after a 292.62% rally in 12 months. Three months later, the weekly chart has printed three lower highs in a row. The trend has flipped from up to down – and the bigger picture might be uglier than most silver bulls realize.
-
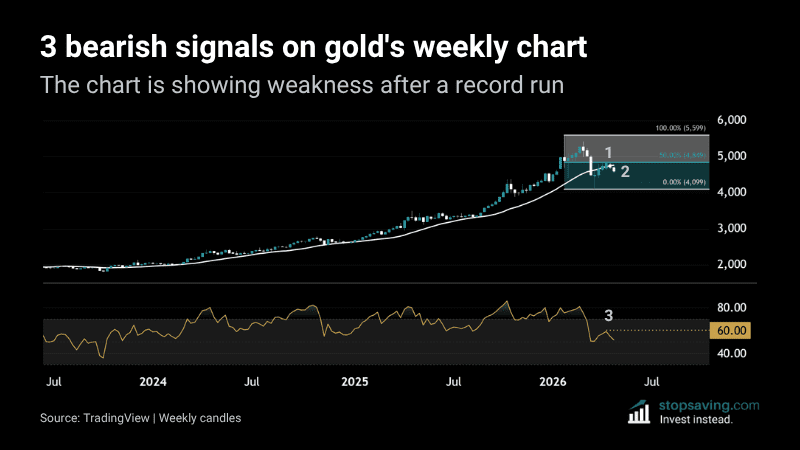
3 Bearish Signals on Gold’s Weekly Chart
Gold started 2024 near $2,000 an ounce – then peaked at $5,599 on 29 January this year. That’s roughly 180% in just over two years. But the rally has stalled. And the weekly chart is now flashing three bearish signals at the same time.
-
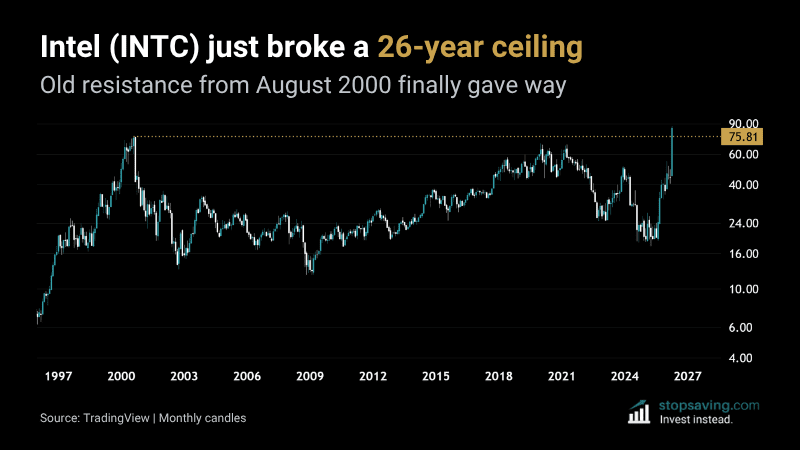
Intel (INTC) Broke a 26-Year Resistance Ceiling
Intel just broke above its August 2000 all-time high after 26 years. Anyone who bought Intel at the dot-com peak waited 26 years to get back to break-even. Last Friday’s weekly close above the old high finally got them there. The stock is now up almost 400% from its April 2025 low.
-
Bitcoin’s Broadening Wedge (The Bull Hopium Case)
Bitcoin has been trading tentatively higher since tagging $60K in early February. But on the weekly chart, a clean broadening wedge is taking shape. If you’re looking for a bullish bitcoin scenario, this is one chart to watch.
-
Global Liquidity Index Explained (How to Use it in Investing)

The Global Liquidity Index (GLI) is a TradingView indicator that tracks global liquidity: how much capital flows through the global economy at any point. It combines central bank balance sheets, money supply, and key US liquidity accounts into a single line. When liquidity expands, it often lifts stocks, crypto, and other investments – making GLI a useful indicator for traders and investors. This guide explains how the Global Liquidity Index works, and how you can use it in the markets.
-
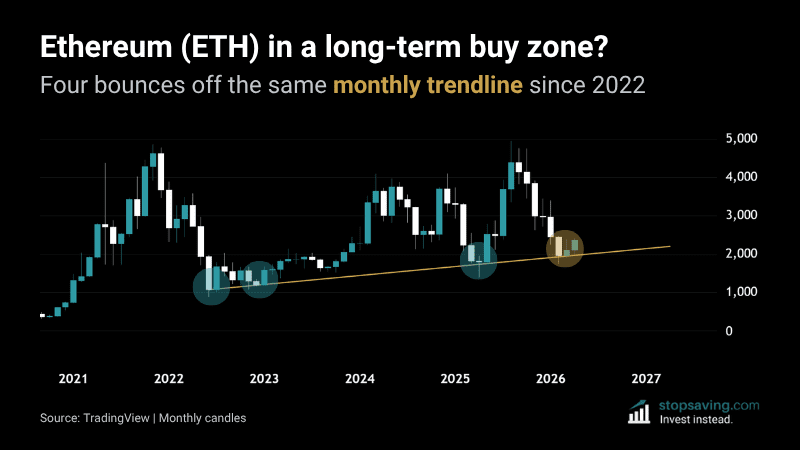
Is Ethereum (ETH) in a Long-Term Buy Zone?
Ethereum just bounced off a long-term monthly trendline for the fourth time since 2022. It happened in July 2022, January 2023, May 2025, and now March 2026. ETH is now trading at roughly $2,350 – about 20% above the gold trendline in the chart.
-
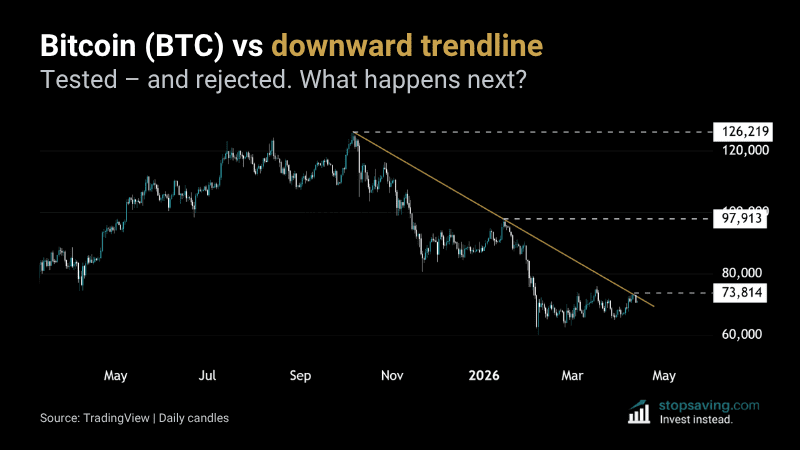
Bitcoin (BTC) vs Downward Trendline
Bitcoin peaked at $126,000 on 6 October 2025. It then made a series of lower highs – and a downward trendline connects them. The second lower high came in around $98,000 in January. The price then crashed to around $60,000 in early February. It’s bounced since – but last week it ran into the trendline and got turned away. Now what?
-
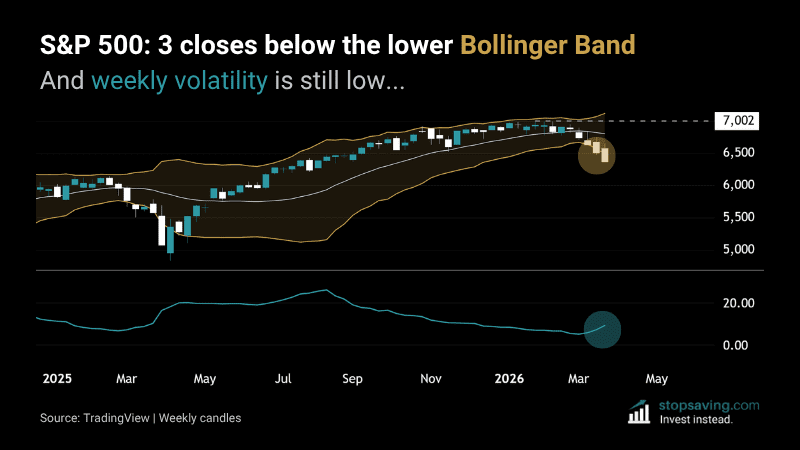
S&P 500: 3 Closes Below the Lower Bollinger Band
The S&P 500 (SPX) topped at 7,002 points on 28 January 2026. It started dropping slowly at first (as many tops do), then faster. Three consecutive weekly candles have now closed below the lower Bollinger Band, which suggests downward volatility is picking up. And here’s the scary part: volatility is still low, according to the indicator.
-
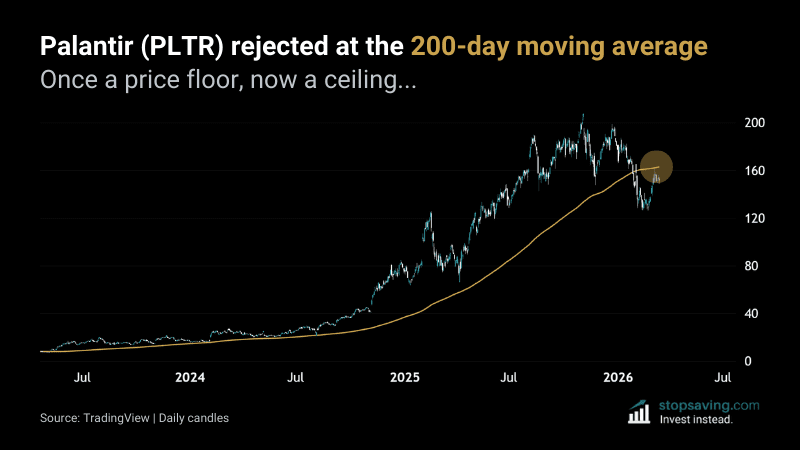
Palantir Stock (PLTR) Rejects at the 200-Day Moving Average
Palantir (PLTR) spent almost 3 years trading above its 200-day moving average in a phenomenal bull run. But now the stock is below it. The line that was once a bull market price floor has become a ceiling.
-
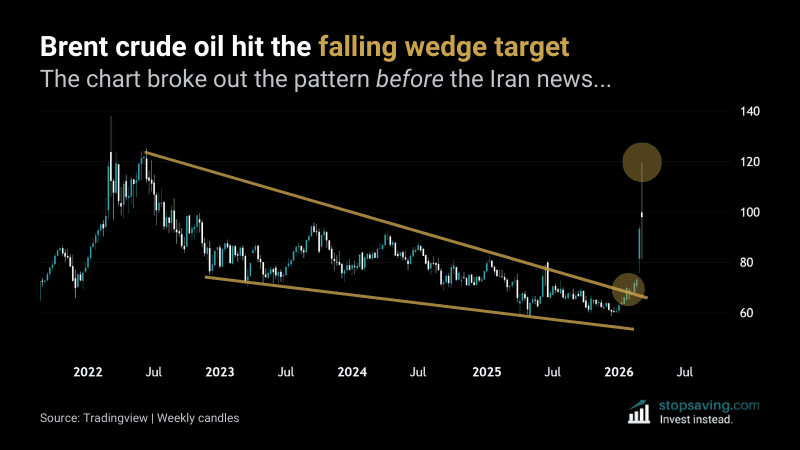
Brent Crude Oil Hit Falling the Wedge Target – Now What?
Two weeks ago, I wrote about Brent crude oil (UKOIL) breaking out of a multi-year falling wedge on the monthly chart. The pattern pointed to higher oil prices. Then on February 28, the US and Israel started bombing Iran. The oil price spiked, hitting the falling wedge target zone around $120 on March 9. Then it reversed back below $100.
This is an unfortunate example of Bernard Baruch’s famous quote: “Show me the chart and I will tell you the news”.
-
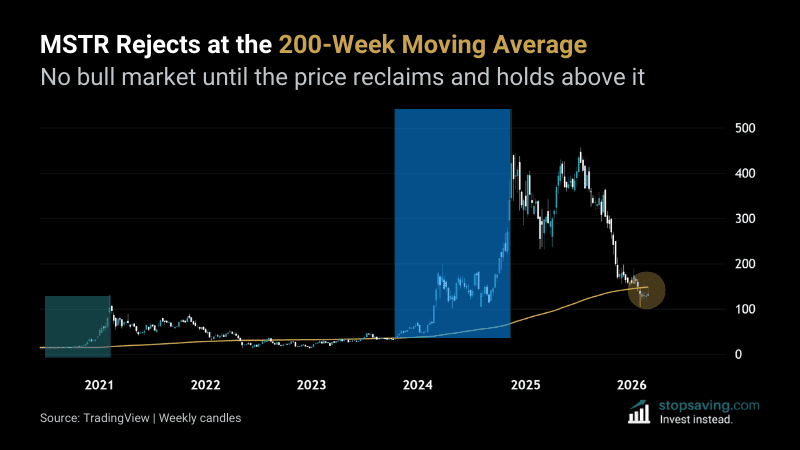
MicroStrategy (MSTR) Rejects at the 200-Week Moving Average
MicroStrategy stock (MSTR) hit its 200-week moving average from below last week – and got slapped back down. The stock’s down about 75% from its all-time high of $543 in November 2024. No bitcoin-era bull run for MSTR has ever started without it first reclaiming – and holding – the 200-week MA.
-
Crypto RSI Heatmap Is Oversold Across the Board
The crypto RSI heatmap is flashing green across almost every major coin right now. The RSI (relative strength index) measures the balance between buying and selling pressure for an investment. The higher the RSI, the stronger buyers are. The lower it is, the stronger sellers are. And right now, sellers are winning almost everywhere. The average weekly RSI across the crypto market is 37.81 – firmly in the “weak” zone.
-
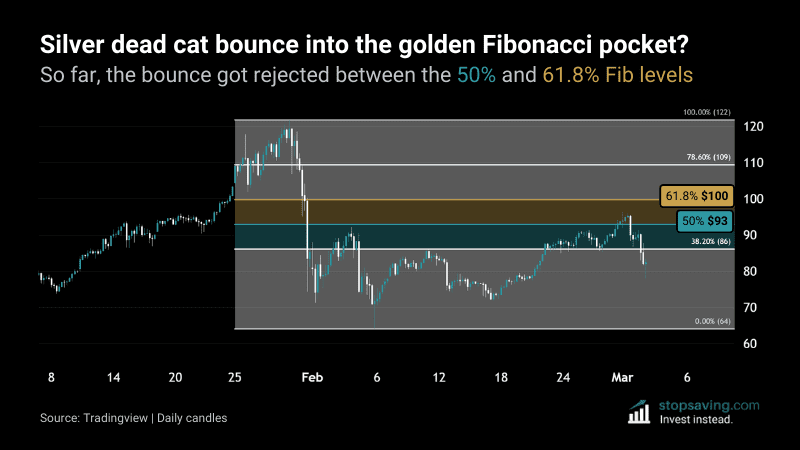
Silver Dead Cat Bounce Into the Golden Fibonacci Pocket?
Silver rallied bigtime off its lows near $64 and pushed into the high $90s. But the daily chart shows the rally just hit a brick wall of sellers – right inside the golden Fibonacci pocket. That’s the zone between the 50% and 61.8% retracement levels. So far, it’s looking like a dead cat bounce for the No.2 metal.
-
TLT Breaks Its 6-Year Downtrend on the Monthly Chart
The iShares 20+ Year Treasury Bond ETF (TLT) just did something it hasn’t done since 2020. It closed a monthly candle above its long-term downtrend trendline. For bond bulls who’ve been underwater for six years, it’s the first real sign the trend might be changing.
-
Brent Crude Oil Retests Its Falling Wedge Breakout
Brent crude oil broke above a multi-year falling wedge on the monthly chart last month. This month, the price came back down and retested the trendline from above – and held. That’s a textbook breakout-retest sequence, and it’s one of the better signals you can get from a chart.
-
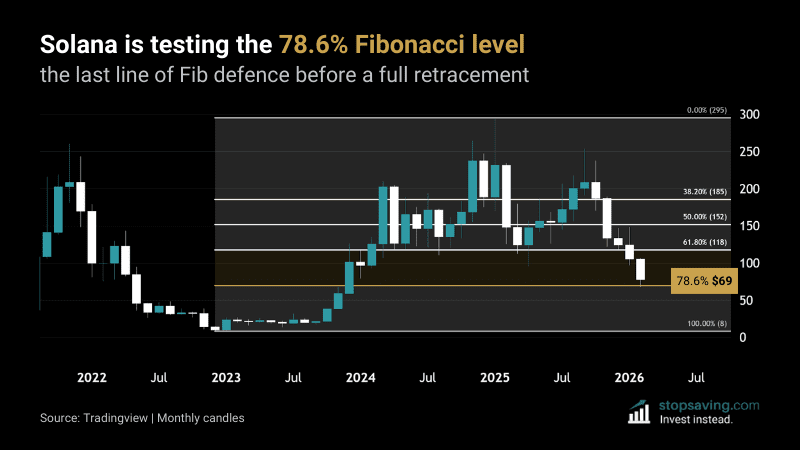
Solana Is Testing the 78.6% Fibonacci Level
Solana (SOL) has pulled back hard from its cycle high near $295. But the price just bounced at a level that Fibonacci traders pay close attention to – the 78.6% retracement. Buyers are stepping in so far. Now they need to prove they can hold it.
-
Coinbase Stock (COIN) Is in a Giant Broadening Wedge
Coinbase stock (COIN) has bounced roughly 30% from its February 12 low of $139. That low came on the same day the company reported $7.2 billion in 2025 revenue and doubled its crypto trading market share. The fundamentals looked strong – but the stock sold off anyway. So what does the chart say now?
-
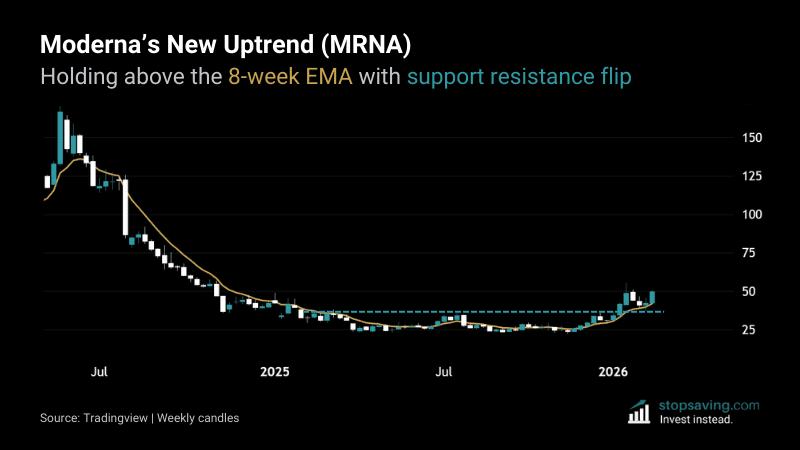
Moderna (MRNA) New Uptrend: Above 8-Week EMA with SR Flip
Not many big biotech stocks are down almost 90% from their all-time highs. After peaking in August 2021 at $497 per share – and then crashing to pre-Covid lows – Moderna has started to rally. The stock is now trading near $50 and is holding above its 8-week exponential moving average (EMA).
The price chart looks like it’s formed a long-term low – turning old resistance into new support. Here’s what to look out for next.
-
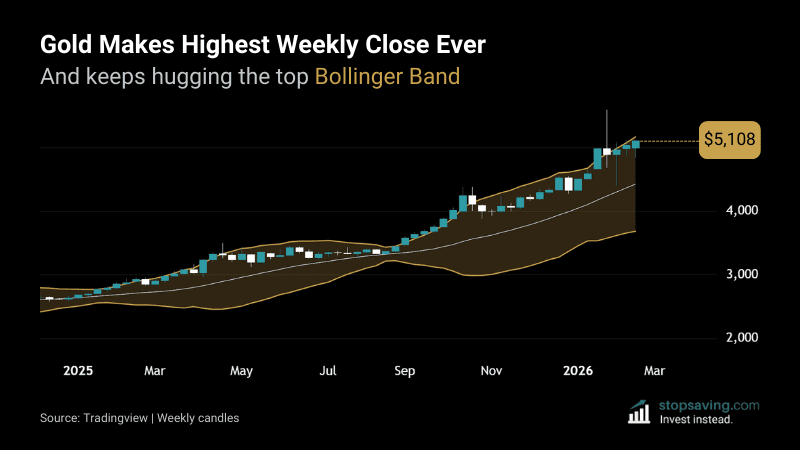
Gold Makes Highest Weekly Close – Near Upper Bollinger Band
They say the trend is your friend until the end. And if you look at gold’s weekly closing prices, the trend is still up. After a 21% drop earlier this year, the gold price just made its highest ever weekly close. That’s its second consecutive close back above $5,000 per ounce since the dip. The price is also hugging the top Bollinger Band each week – a sign of a strong uptrend in motion.
-
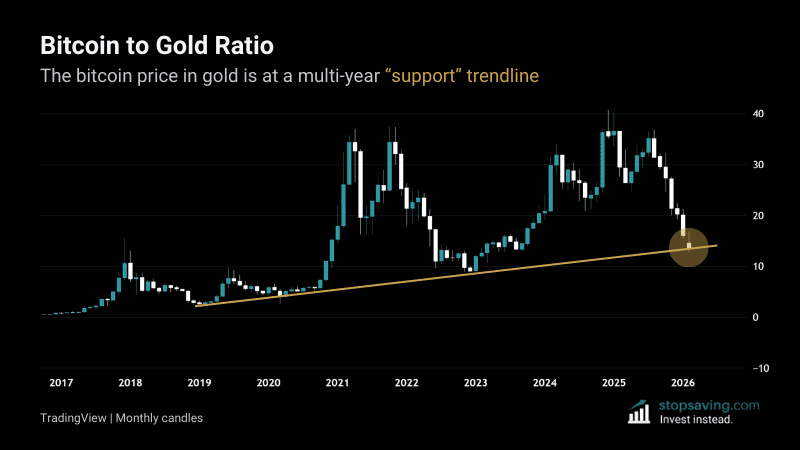
Bitcoin to Gold Ratio at Long-Term Support Trendline
The bitcoin to gold ratio – which measures the bitcoin price in gold ounces – is at a potential support level. The trendline connects the monthly closing lows of 2019, 2020, and 2023. If the trendline holds, bitcoin could find its next major low against the yellow metal.
-
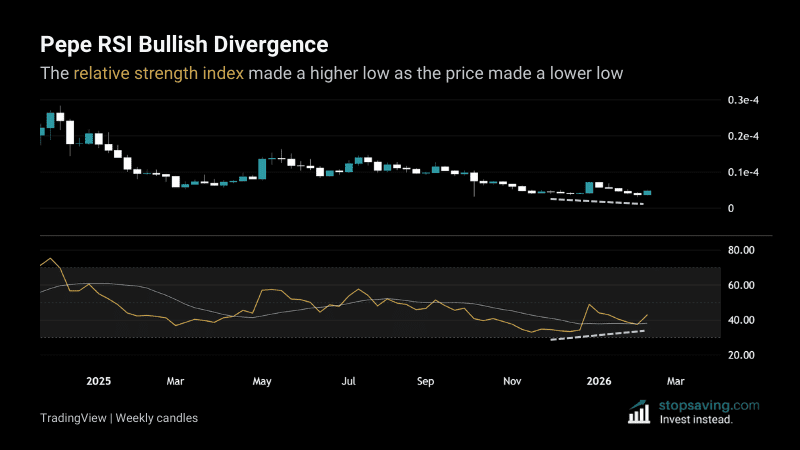
Pepe RSI Bullish Divergence – Crypto Risk Appetite Back?
Pepe rallied about 27% yesterday, and is now up over 50% since bitcoin bounced at $60,000. This chart suggests there could be more upside for the memecoin – and crypto risk appetite is trickling back.
-
Nasdaq Double Top Potential as Bollinger Bands Squeeze
The Nasdaq 100 index could be forming a double top pattern on the weekly chart. And if you follow Bollinger Band theory, now would be a time to be cautious on US big tech stocks. Here’s the rationale behind the theory, and what to look out for next.
-
Bitcoin Weekly RSI At Rare Oversold Level
Bitcoin’s weekly RSI opened at 27.4 on Monday – one of its “most oversold” levels ever. That doesn’t guarantee the bottom is in, but it does mean sellers are overstretched.
-
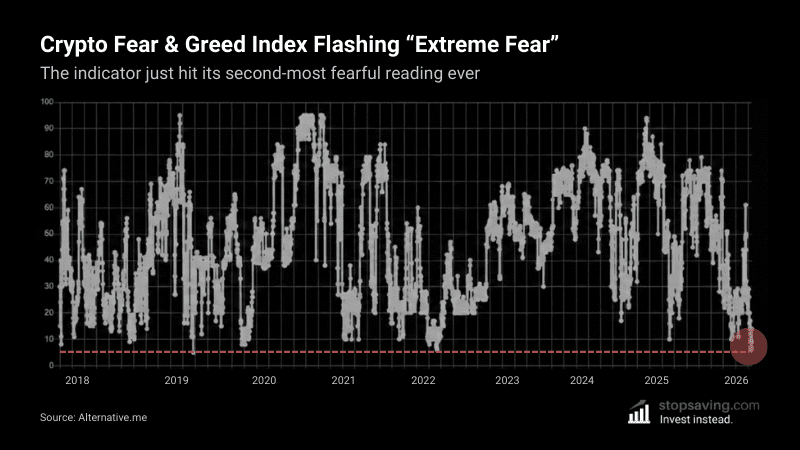
Crypto Fear and Greed Index Hits Second-Most Fearful Ever
The Crypto Fear and Greed Index hit 6 during last week’s crypto crash – its second-lowest reading ever. The lower the reading, the more extreme the fear among crypto investors, according to the indicator.
-
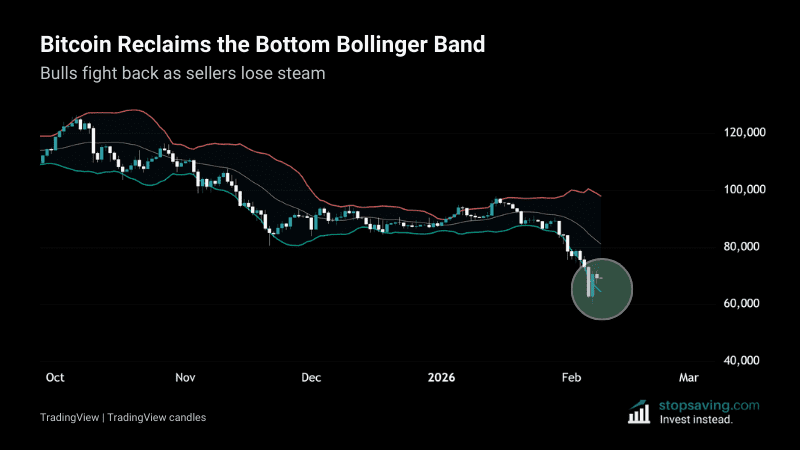
Bitcoin Reclaims the Bottom Bollinger Band
After bitcoin hit $60,000 this week, buyers stepped in. The price then closed back above the lower Bollinger Band (green) – a sign that sellers are tiring. That doesn’t promise the low is in, but it’s an important win for the bulls. Here’s why.
-
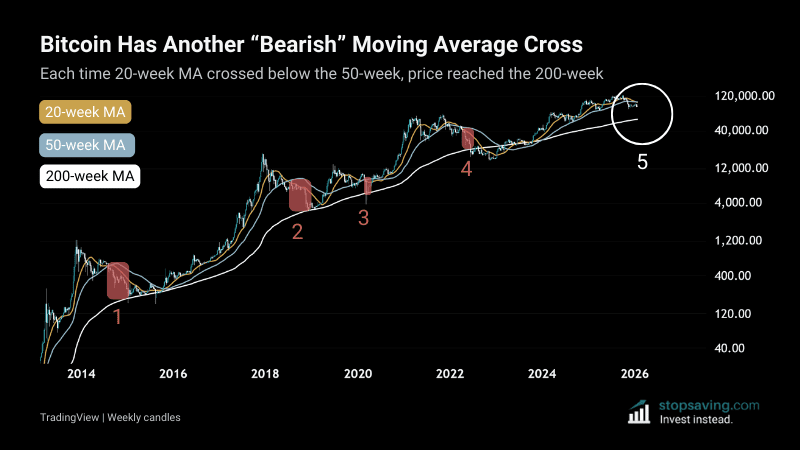
Bitcoin Has Another “Bearish” Moving Average Cross
If you’re looking for a bearish bitcoin scenario, history could be on your side. Bitcoin just had another “bearish” moving average cross: the 20-week moving average (MA) has crossed below the 50-week MA. That’s only happened four other times since 2014. On each of those occasions, the bitcoin price drifted down to the 200-week MA.
-
Gold Volatility Is Rising With The Rally
The gold price has more than doubled since clearing $2,000 an ounce in early 2024. And with it, gold volatility has kept rising. According to the monthly Bollinger Bands, volatility hasn’t been this high since 1982.
-
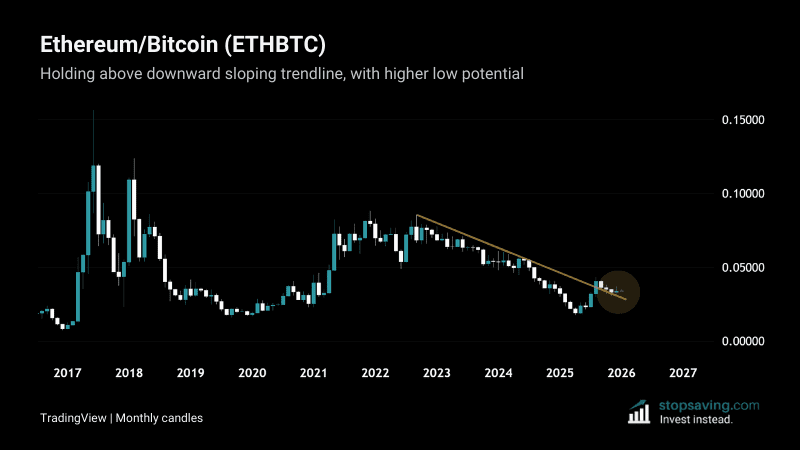
ETH/BTC Is Retesting a Key Trendline – And Holding It So Far
Ethereum is up almost 100% against bitcoin since the ETHBTC ratio (ETH/BTC) bottomed at 0.018 in April 2025. The ratio is far from making a new high – but it is attempting its first higher low in years. It’s also holding above the downward sloping trendline (gold, in the chart).
-
Bitcoin Weekly Chart Prints Triple RSI Bearish Divergence
This chart shows three drives of bearish divergence between the bitcoin price and its relative strength index (RSI). Since the start of 2024, the price made higher highs as the RSI made lower highs. So even though the price is going up, it’s rising with less force each time, according to the indicator.
-
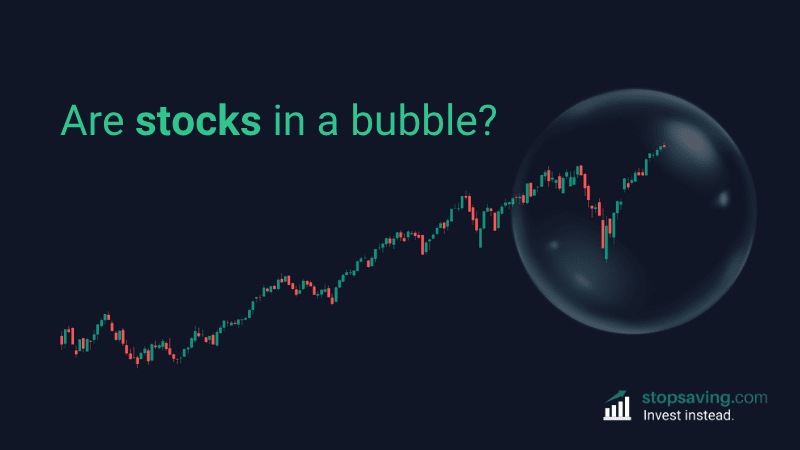
Are We In a Stock Market Bubble? (3 Warning Signs to Watch)
Stocks are at all-time highs, Big Tech is booming, and Nvidia is worth more than entire countries. So the obvious question is: are we in a stock market bubble? This post breaks it down simply. We’ll explain what a bubble actually is, and then check three warning signs to see if we’re in one today.
-
Bitcoin Dominance Bounces At The Bottom Bollinger Band
Bitcoin Dominance (BTC.D) measures the percentage share of the crypto market made up of bitcoin. When it goes up, it means bitcoin is generally outperforming the rest of the crypto market (regardless of whether both go up or down in dollars). In other words, a rising bitcoin dominance does not spell “altcoin season”.
-
Bitcoin Trend: One Log Trendline To Track The Bull Run
If you’re trying to track the bitcoin trend, the green trendline in this chart can help. Bitcoin has bounced off it many times during the current bull run, which began in 2023. As long as the trendline holds, it’s difficult to call for any sort of “bitcoin top” this cycle. That said, the trendline will break at some point, which could be where things turn more bearish for bitcoin.
-
XRP Chart Analysis: 3 Things To Watch
XRP has been a top performer this crypto cycle – but it might not be the best time to FOMO in. This chart tracks the weekly price candles of XRP to focus on the longer-term trend (rather than short-term noise). Here are three things to keep in mind.
-
Gold Chart – Ascending Triangle and Technical Targets
The price of gold has squeezed into a tighter trading range over the past few months. The chart now shows a textbook ascending triangle – typically a bullish pattern in technical analysis. It’s a sign of buyers getting more aggressive, as the price keeps bouncing off higher support. But they’ll need to break that wall of sellers (near $3,500) to put the gold rally back on track.
-
Tick Tock Goes The 10 Year Yield Clock
This chart shows the 10 year yield on US Treasury bonds – arguably the most important chart in financial markets right now. It’s been squeezing into a tighter range for the past year, after a massive run-up post-Covid. When it breaks out of that range, we could see a ripple effect across other investments. It’s calm now, but the range will eventually break.
-
Bitcoin Hits Golden Fibonacci Extension of Last Bull Run
Bitcoin just touched a major level – the 1.618 golden Fibonacci extension of its last bull market. It popped just above it earlier this week, but is now trading back below it. So far, the golden Fib has “rejected” bitcoin from running higher. Here’s what it means.
-
Ethereum Dominance (ETH.D) Bounces After All-Time Low
Ethereum Summer is in full swing – according to the Ethereum dominance chart (ETH.D, TradingView). On April 21 of this year, ETH.D hit an all-time low of 6.95%. Since then, it’s been sunshine and blue skies, with the metric trading at over 11% today.
-
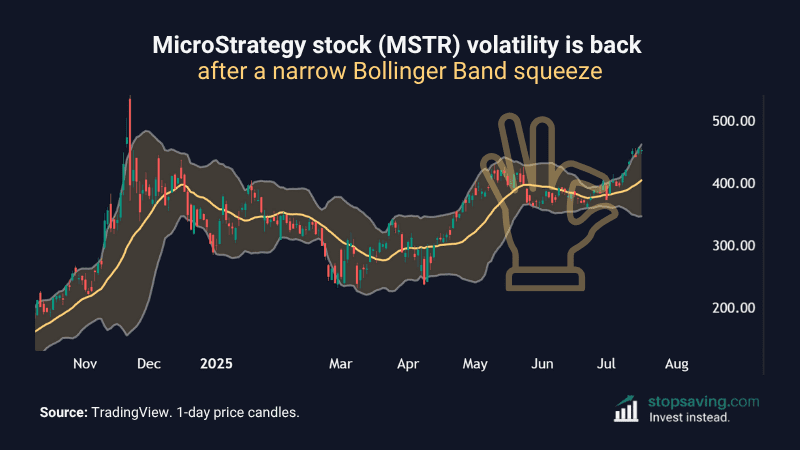
MicroStrategy Volatility – Back From Bollinger Band Squeeze
With bitcoin breaking out to new highs lately, MicroStrategy stock (MSTR) is waking up again. This chart shows the daily price candles of MSTR, and the Bollinger Bands surrounding it. In late June, the bands squeezed together tightly – meaning volatility dropped off. But now that the bands are getting wider, volatility is back with a vengeance.
-
Tokenized Stocks Explained (And How To Invest)
Over $130 trillion worth of stocks trade on global stock markets today – but less than $20 million of those are tokenized. If most stock ownership eventually goes on the blockchain, we could be onto something big. This guide breaks down what tokenized stocks are, how they work, and three potential ways to invest in the trend.
-
Bitcoin 6-Month Candles: 5 Green In a Row
Bitcoin has printed five 6-month green candles in a row, with the price going up every 6-months since January 2023. The last time it did that was between July 2015 and December 2017 – though the percentage price jump was much higher back then. Still, this bitcoin bull run has been steady and consistent.
-
How to Earn Bitcoin Interest (3 Ways)
Bitcoin doesn’t pay interest or dividends on its own. It’s more like gold or silver: the reward is all in the price. But while you wait for the bitcoin price to hit the moon, you may want to put your coins to work. So in this guide, we’ll explain three ways to earn bitcoin interest – each with different levels of risk.
You’ll learn how each option works and which one could best suit your goals.
We produced this guide in partnership with Xapo Bank*.
-
Why 1 Bitcoin Is Worth More Than a Kilo of Gold (3 Reasons)
The chart below compares the price of one bitcoin (blue line) with the price of one kilo of gold (gold line). Both are in US dollars. As you can see, a single bitcoin is now worth more than a kilo of the yellow metal. What’s even more interesting is how quickly the premier crypto has caught up over the past five years.
-
US Dollar Drop: Biggest 6-Month Red Candle Since 1991
The US dollar just had its biggest six-month drop since 1991. The US dollar index (DXY) tracks the dollar’s value against six major currencies. It fell 10.82% from January through June.
-
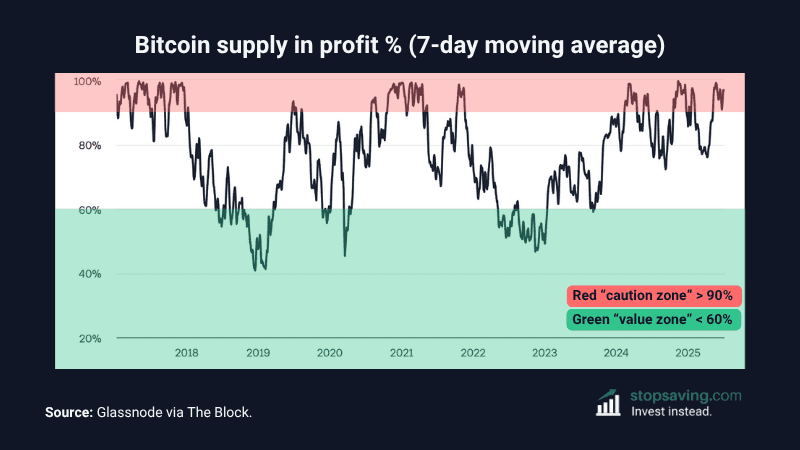
Bitcoin Supply in Profit % in the “Caution Zone”
The bitcoin price is trading close to all-time highs – which is technically a good thing if you’re bullish. But the “bitcoin supply in profit” chart says it could be wise to keep your wits about you. Over 95% of bitcoin holders are now sitting in profitable positions. When many holders are in profit, even a small wave of selling can move the price.
-
Total 3 Chart Analysis: Two Trendlines and the 20-Week SMA
Altcoins could be coiling up for a move, according to this TOTAL 3 chart. The TOTAL3 chart tracks the altcoin market, less bitcoin and ethereum. It’s wedging into a giant triangle pattern, squeezed between two clear trendlines.
-
A US Treasury Bond Trade Setup For UK Investors
If you’ve followed my recent articles, you’ll know I’ve been banging on about US Treasury bonds for some time. Specifically, long-dated US Treasury bonds that mature in 20 years or more. My general thesis is that these bonds could do well if US interest rates and inflation both drop. If you’re a UK investor (like me), here’s how to get exposure to the trade.
-
How to Tell If the Next Bitcoin Breakout Isn’t a Fakeout
There’s an old saying among breakout traders: “Show me an all-time high, and I’ll show you a buy.” Bitcoin’s last all-time high was just below $112,000 (set in May), and it’s teasing that level again now. Here’s how to gauge if this possible bitcoin breakout could be the real deal – or just a fakeout.
-
3 Bitcoin Price Predictions for 2025 (Ignore Them)
Analysts throw out clever bitcoin price predictions all the time. Here are three big calls from well-known investors for 2025 – and why you should probably ignore them.
-
The Case for an AI Recession (And How to Invest)
Artificial Intelligence (AI) can make businesses more efficient, but it can also put people out of work. Here’s why AI might cause the next recession, and how to invest if it happens.
-
How to Store Bitcoin Safely: Security and Custody Explained
Bitcoin security starts with how you store it. Even though the blockchain itself is unbreakable, your coins are only as safe as your storage method. In this guide, we’ll break down how to store bitcoin safely – comparing custodial vs non-custodial wallets, hardware devices, mobile apps, and other options. You’ll learn how to choose the right setup for your goals, risk tolerance, and level of control.
-
Silver Nears Key Resistance at the Golden Fibonacci (61.8%)
Silver’s climbed about 200% since its Covid crash low in 2020 – and it’s now approaching a major technical resistance level. This chart shows the 61.8% “golden” Fibonacci level at $35.24 per ounce. If silver gets there, that’s a 61.8% recovery of the drop from its 2011 peak ($49.83) to its 2020 low ($11.64).
Most technical traders will be watching this level to gauge what silver does next.
-
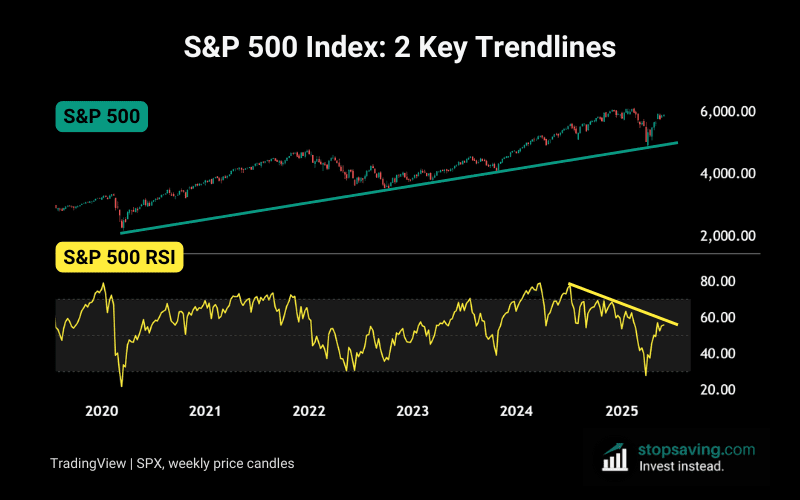
S&P 500 Trend: 2 Key Trendlines to Watch
The S&P 500 index tracks the 500 biggest companies in the US stock market. Here are two key trendlines to help you gauge its overall trend.
-
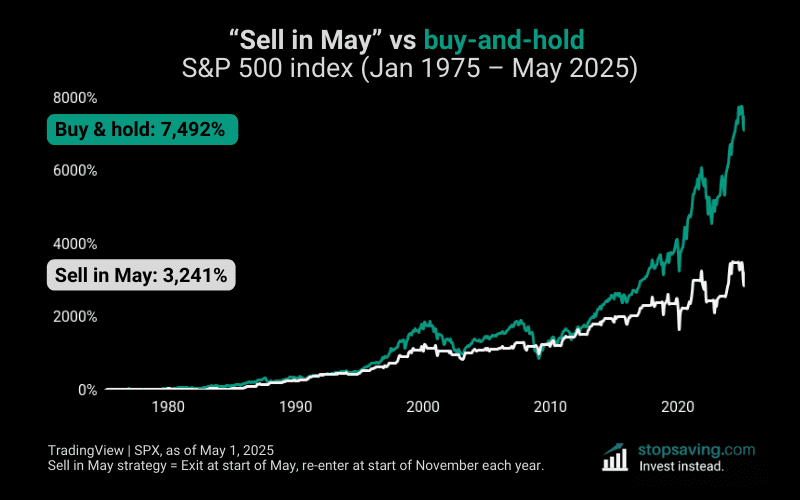
Sell in May vs Buy and Hold – What the Data Says
“Sell in May and go away” is one of the oldest seasonal strategies in investing. The idea is simple: sell stocks on the first trading day of May to avoid the summer chop. Then buy back in November, when big investors are back at their desks and year-end rallies often begin. But how has that strategy stacked up in the past? Here’s what the data says over the past 50, and 25 years.
-
Gold vs Silver Chart: $100 Invested Since 1975
This chart tracks the value of $100 invested in gold vs silver since 1975. Over the past 50 years, the gold investment would be worth about $1,800 – more than double the silver one (~$800). But gold hasn’t always been ahead of silver. The silver investment had higher peaks in 1980 and 2011 (major bull market tops for the metals).
-
Tesla Bounces At The Golden Fibonacci (After Weak Earnings)
Tesla reported weak Q1 2025 earnings on Tuesday. But the stock price closed Wednesday over 5% higher – and the market is wondering why. This chart may hold the answer: Tesla bounced right off the 61.8% Fibonacci retracement – the so-called “golden ratio.” That level often acts as strong price support after big downward moves. That’s as good a reason as any for a bounce (despite the bad news).
-
Gold vs US Dollar Index (DXY) – A Tale of Two Safe Havens
Gold is up about 26% this year, while the US dollar index (DXY) is down 8.5%. The chart says it all: gold’s golden run in 2025 has (so far) mirrored a steady slide in the dollar. Gold is priced in dollars – so when the dollar drops, gold gets cheaper for buyers using other currencies. That cheapness can boost gold demand and push up its price.
-
Downside Fibonacci Targets (If Bitcoin Has Already Topped)
If bitcoin has already peaked for this market cycle, you can naturally expect a bear market. In that case, the chart below shows some potential downside targets using Fibonacci retracement levels. These zones could make for good long-term bitcoin buys.
-
DXY Chart – Support/Resistance Flip For The US Dollar
The US Dollar Index (DXY) is holding above a key zone between 100 and 102 (green, in the chart). And it’s not just any zone: this acted as resistance (a ceiling) from 2015 to 2022. But after breaking that ceiling in 2022, the zone flipped into support (a floor). It’s a classic support/resistance (S/R) flip, and here’s why it matters for the markets.
-
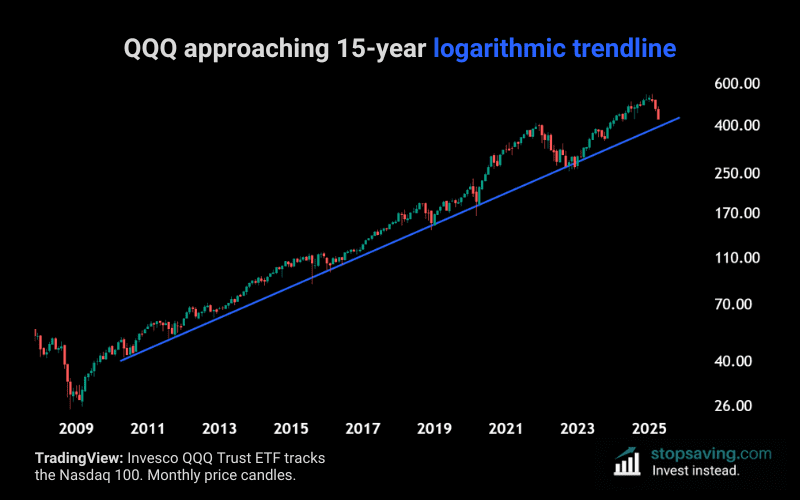
QQQ is Near its Long-Term Trendline (Again)
The Invesco QQQ ETF (QQQ) tracks the Nasdaq 100 – the go-to index for big tech growth stocks. Since 2010, the upward trendline in blue has supported QQQ’s price – and it’s now getting close to it again. As the chart suggests, buying the QQQ exchange-traded fund near the trendline worked out well in the past.
-
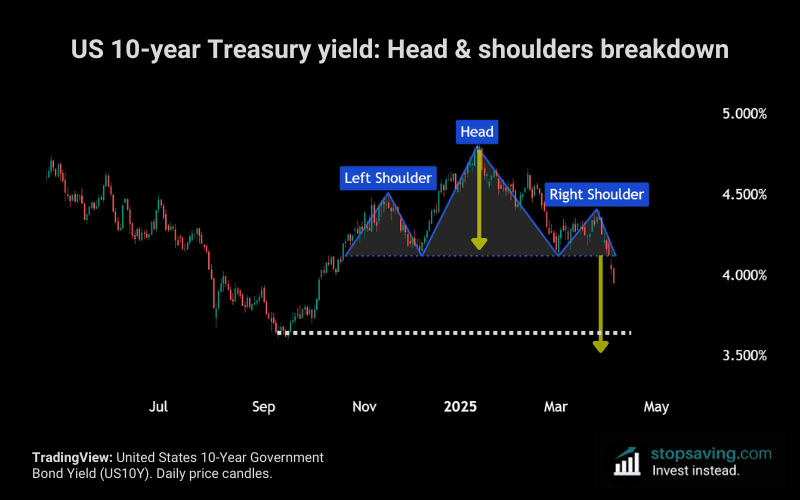
US 10-Year Treasury Yield (Head & Shoulders Breakdown)
The US 10-year Treasury yield just dipped below 4% for the first time in months. This was after breaking down from a textbook head and shoulders pattern (blue, in the chart). And it could be a big deal for bonds, stocks, and the economy.
-
Stochastic RSI Explained (How to Use It In Trading)
The Stochastic RSI takes the regular RSI a step further. Instead of looking at price momentum, it looks at the momentum of RSI itself. This guide explains what the Stochastic RSI is, how it works, and how to use it the right way in the markets.
-
Own Gold and Hope it Doesn’t Go Up (But Maybe Rebalance)
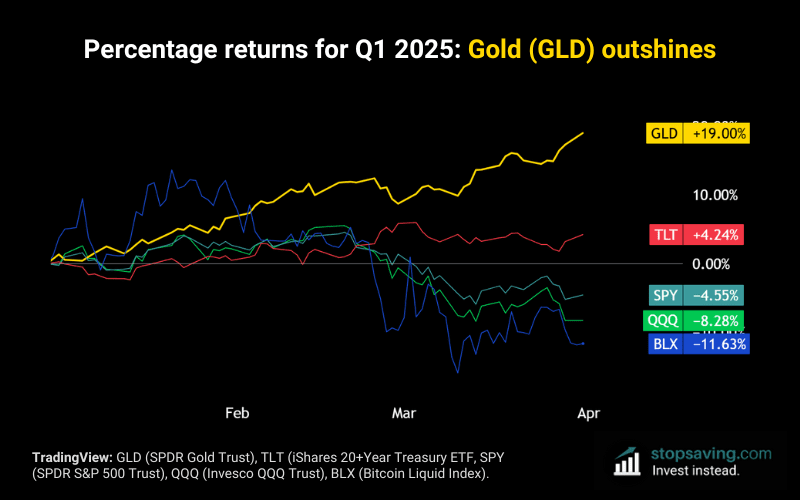
There’s an old saying on Wall Street: “put 10% of your wealth in gold and hope it doesn’t go up”. And in the first quarter of 2025, that insurance policy paid off. The chart shows the percentage returns of different investments from the start of this year through the end of March. The SPDR® Gold Shares ETF (GLD) – which tracks the gold price – gained 19%.
-
GameStop (GME) Bitcoin Bet & RSI Hidden Bullish Divergence
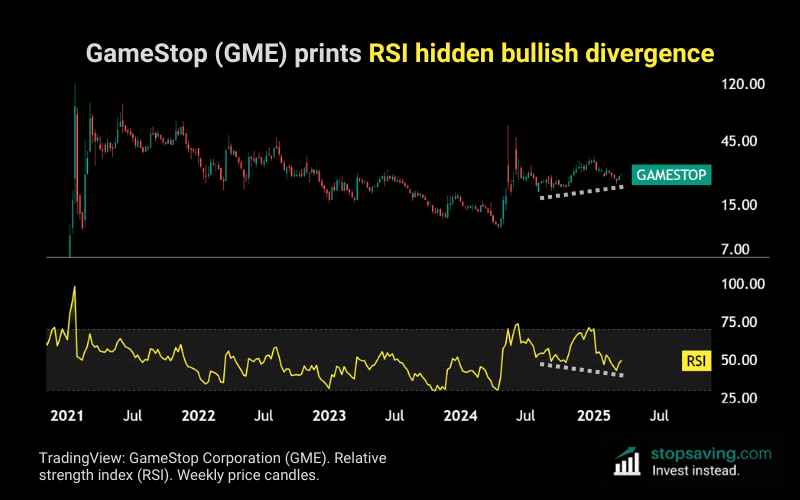
GameStop (GME) has been quietly recovering for the past year, with the stock making higher lows (see chart above) on the weekly time frame. Meanwhile, its relative strength index (RSI, yellow) has formed lower lows – this is called a hidden bullish divergence. Put simply, the price has been climbing even though selling pressure has increased relative to buying pressure. In other words, sellers have been trying to push GME lower, but so far, they haven’t managed it. Now, with GameStop announcing plans to buy bitcoin, the stock looks more interesting for speculators.
-
MicroStrategy Bitcoin Strategy Explained (Simple Breakdown)
MicroStrategy (MSTR) used to be just a software company – but today, it’s the world’s biggest corporate bitcoin holder. This guide explains the MicroStrategy bitcoin strategy in plain English: how it works, why they’re doing it, and what the risks are. You’ll also see how MSTR has performed compared to bitcoin, Nvidia stock, and the Nasdaq 100.
-
House Prices In Gold Are Getting Cheaper (3 Charts)
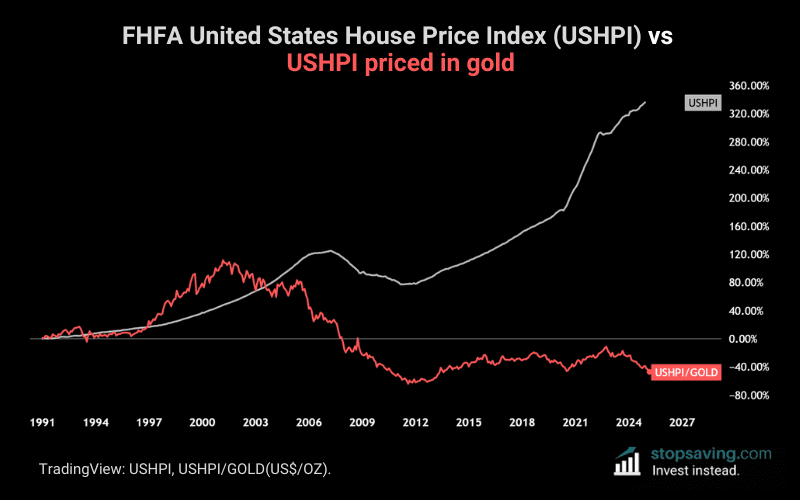
Property prices have climbed quite a bit over the years. But if you measure house prices in gold (instead of regular currencies), buying a home has actually gotten much cheaper. Here are three charts for the US, UK, and European Union (it’s similar with other countries, too).
-
Bitcoin Supply: Over 95% Has Already Been Mined
If there was ever a reason to consider bitcoin as a long-term investment, this chart would be it. It tracks bitcoin’s total supply since Satoshi Nakamoto mined the first bitcoin block on January 9, 2009. Today, over 95% of all the bitcoin supply has already been created by miners. The remaining 5% will take another 115 years or so to mine – with all 21 million coins mined by 2140.
-
Bitcoin’s 200-Day Moving Average Test: CME Futures on the Line
The price of CME Bitcoin Futures (BTC1!, TradingView) is down roughly 30% since January 21st. Now, it’s testing the 200-day moving average (SMA) – a key support level since the bitcoin bull run began in 2023. For bitcoin’s uptrend to stay intact, you’ll want to see the 200-day SMA hold.
-
Nvidia Volatility is Rising (From a 4-Year Low)
Nvidia stock’s volatility – measured by the weekly Bollinger Bands – reached a four-year low earlier this month. And after Wednesday’s earnings report, that volatility is now starting to make a comeback. When volatility returns after being ultra low, it usually overcompensates – that’s how volatility works. In other words, Nvidia Stock (NVDA) could be gearing up for a relatively big move.
-
Solana Bounces Off Support – 20-Week Moving Average Above
After hitting $295.11 in January, Solana (SOL) crashed to $130.51 in February – down 55.78%. So far, SOL is bouncing off a major support region between $125 and $135 (green, in the chart). That said, Solana is now trading well-below its 20-week moving average (SMA, gold) – which could become resistance.
-
Safest Investment Over Past 5 Years? (What The Data Says)
Not all investments are created equal – some swing like a rollercoaster, while others barely budge. If you’re wondering what the safest investment was over the past five years, I crunched the numbers for stocks, bonds, gold, and bitcoin. I measured volatility (risk), drawdowns (worst-case scenario losses), total returns, and Sharpe ratios (risk-adjusted performance) using data from PortfolioVisualizer. Here’s how the results stack up.
-
Gold’s 8-Week Rally: History Says Correction Could Be Next
The gold price has climbed for eight weeks straight now – a rare feat for the yellow metal. Since 1980, that’s only happened four times. Each time, the rally was followed by a correction shortly after.
-
S&P 500 Flashes Bearish Signal: Stock Market Drop Possible
A US stock market drop could be on the table if the latest RSI bearish divergence signal plays out. The S&P 500 (which tracks the top 500 US stocks) has made four consecutive higher highs since April 2024 (gray in the chart). Meanwhile, the relative strength index (RSI, gold) has made four consecutive lower highs.
-
Bitcoin Volatility At Extreme Lows – Big Move Brewing?
Bitcoin volatility has collapsed to extreme lows. History says that won’t last forever – and bitcoin could be gearing up for a big move. According to the Bollinger Band Width Percentile (BBWP) indicator, bitcoin’s day-to-day price swings are now at their lowest levels since July 2020.
-
Hedge Funds Are Short Ethereum – Could It Backfire?
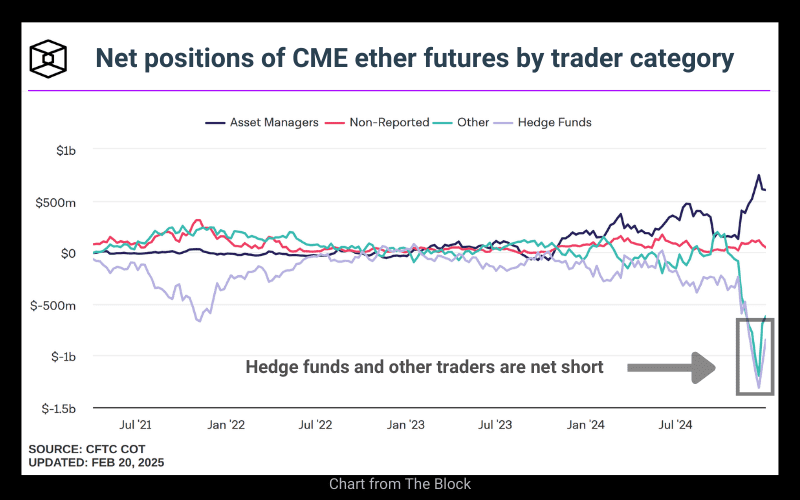
Ethereum has been in the spotlight lately, but not in a good way. Hedge funds are going short Ethereum (ETH) futures on the Chicago Mercantile Exchange (CME) in record amounts. And while that might seem bearish at first, the reality is a bit more complicated.
-
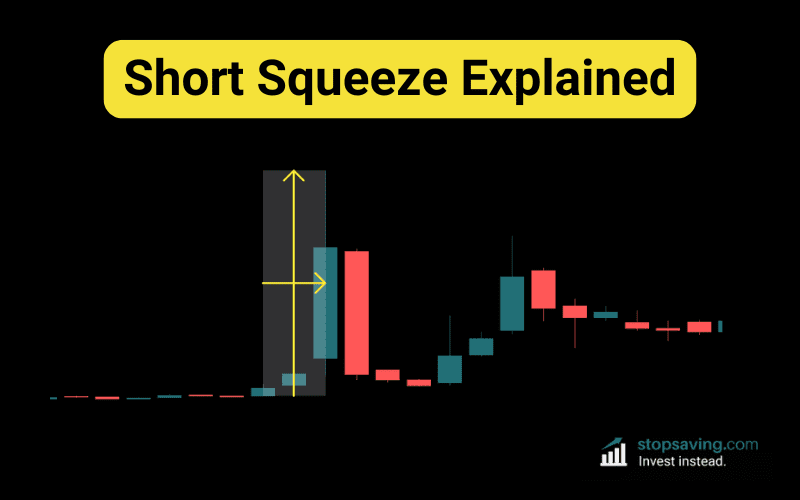
What Is a Short Squeeze? How It Works and How to Trade It
Most traders love a bull run, but nothing moves a market quite like a short squeeze. When short sellers get trapped, prices can skyrocket in a chain reaction of forced buying. In this guide, I’ll explain what a short squeeze is and how it works using real-life examples with stocks and crypto. We’ll then wrap things up with how to trade a short-squeeze to your advantage.
-
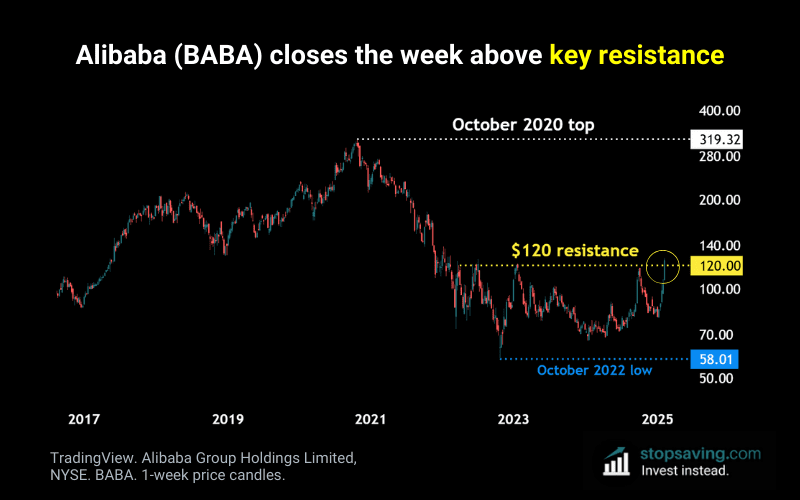
Alibaba Stock Breaks Resistance – Bigger Breakout Ahead?
Alibaba stock (ticker: BABA) has spent years in the doghouse, but its fortune cookie might finally have a new message. The Chinese tech stock just broke above key resistance at $120 after trying (and failing) twice before. That’s a big deal. With earnings around the corner and macro factors at play, is this the start of a bigger BABA breakout?
-
Crypto DCA Explained: How Dollar Cost Averaging Works
Crypto trading isn’t for everyone – some prefer a longer-term crypto DCA (dollar cost averaging) strategy to build wealth. This guide explains how DCA works and why it can be effective with highly volatile assets like bitcoin.
-
Gold Miners vs Gold: Relative Value or Long-term Loser?
They say in a gold rush, you should sell shovels – not dig for gold. But if you’d bet on gold miners vs gold itself over the past 20 years, mining stocks would be down big against the metal. This chart divides the VanEck Gold Miners ETF (GDX) by the gold price to get a ratio. The ratio fell roughly 75% since GDX launched in 2006 – meaning gold was a much better investment since then.
-
What is Bitcoin Dominance (BTC.D)? And How To Use It Right
If you trade or invest in crypto, you may have come across the term “bitcoin dominance”. In this guide, we’ll explain what bitcoin dominance is, how it works, and how to use it correctly in your crypto strategy.
-
Ethereum Falling Wedge Pattern – ETH Breakout Ahead?
If you’re into crypto pattern trading, they don’t come much cleaner than this. The chart shows an Ethereum falling wedge: a sign of price compression that might signal a potential bullish breakout for ether (ETH). Each red or green candle on the chart represents one day of price movement. The wedge is based on closing prices each day.
-
US Dollar Inflation: $1 in 1913 Is Worth $32 Today
The US dollar inflation rate (CPI) has averaged about 3.2% per year since 1913 (when the Federal Reserve (Fed) started). That might not sound like much, but over time, it really adds up. According to this chart, $1 in 1913 is worth about $32 today – with the dollar losing about 97% of its value. A millionaire in those days was more like a billionaire today.
-
TLT Prints Weekly Bullish Engulfing Candle – Bond Rally Next?
The iShares 20+ Year Treasury Bond ETF (Ticker: TLT) rallied almost two percent this week from open to close (13 to 17 Jan). But here’s the important bit: that rally completely eclipsed the drop the week before – when panicked investors threw in the towel. As the chart shows, TLT printed a bullish engulfing candle this week. And as the name suggests, that might be a bullish sign for the US government bond market.
-
Bitcoin’s Head and Shoulders Pattern “Failure”: $120K Next?
The head and shoulders crowd were at it again this week – as bitcoin started breaking down below $91,000. That’s a key support level for a head and shoulders pattern that was brewing since late November (in the chart). Bitcoin had a massive rally from October, and then started stalling, so a bigger drop wasn’t out of the question.
-
What Is the Fear and Greed Index? Guide for Stocks & Crypto
The Fear and Greed Index can help you gauge whether the market is fearful or greedy on a given day. There’s a fear and greed index for the stocks, and another one for crypto. In this guide, we’ll unpack how each one works – and how to use them in your trading or investment strategy.
-
What Is The DXY Index? A Guide For Traders & Investors
The US dollar is like a wrecking ball for the global economy. When it swings, it can smash through financial markets, trade, and even debt costs. The DXY Index (US Dollar Index) helps traders and investors track these movements – showing how the dollar stacks up against six major currencies. In this guide, you’ll learn what the DXY is, and why it matters for your investments.
-
Bitcoin Options Explained: Understanding Calls and Puts
Bitcoin options might sound complex, but they’re simpler than you think. This guide breaks down the theory of bitcoin call and put options. By the end, you’ll understand how they can help traders speculate on bitcoin’s price moves – or earn option income. Let’s jump in.
-
Liquidation Heatmap Explained (How To Use It in Crypto)

The liquidation heatmap is like a crypto weather radar – it can help you spot the next big crypto liquidation storm. In this guide, I’ll explain what the crypto liquidation heatmap is, how it works, and how to use it the right way in your trading or investment strategy. Let’s jump in.
-
Bitcoin and Gold: Why Own One When You Can Own Both?
Gold bugs and bitcoiners have been bickering for years, but they should have been getting along. According to this chart, owning both bitcoin and gold in your portfolio could be a winning combination.
-
The Hang Seng Is Back To Its Covid Crash Low

The Hang Seng Index surged 18.31% in September, in what can only be described as a monthly “God candle”. The Hang Seng (HSI) currently tracks the biggest 82 companies listed on the Hong Kong Stock Exchange, including Chinese tech giants like Tencent and Alibaba. At the end of September, the Hang Seng finished at 21,134 points (blue) – just five points shy of its March 2020 Covid crash low (gold).
-
Nasdaq vs S&P 500: Tech Stock Supremacy Since Dotcom Low

This chart shows the performance of the Nasdaq vs S&P 500 from the dotcom bubble. Since the dotcom bottom in October 2002, investing in the Nasdaq 100 (NDQ, TradingView) would have beaten the S&P 500 (SPX) by almost 250%. But even with that massive gain, it took about 18 years for the Nasdaq to get back to its dotcom peak level (compared to the S&P 500).
-
Bitcoin vs Silver: Tracking the Growth of Digital Gold
Bitcoin has some way to go before it overtakes gold in market size, but it’s already about 73% as big as silver. This chart tracks the bitcoin vs silver market size ratio, which is currently 0.73 (yellow). The ratio divides bitcoin’s total market size (CRYPTOCAP:BTC, TradingView) by the approximate market size of silver. Back in March, the ratio hit 1.04 (blue)—meaning bitcoin’s total market value was briefly above silver’s.
-
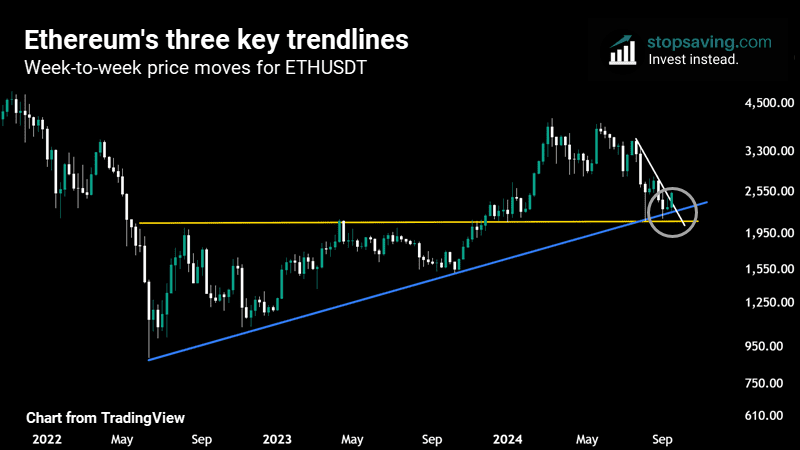
How To Trade Ethereum In Q4 2024 (3 Simple Trendlines)
Wondering how to trade Ethereum in the fourth quarter of 2024? Here’s one approach, using three simple trendlines to manage risk.
-
Crypto Funding Rate Heatmap Explained (How To Use It Right)

The funding rate heatmap is a useful tool for crypto investors. In this guide, I’ll explain what it is, how it works, and how to use it correctly in your strategy. Especially when it comes to managing risk and avoiding big losses. This guide was first published in March 2024, but was updated to include a video version in July.
-
Should You Use an AI Financial Advisor? Pros and Cons

Artificial intelligence (AI) is changing the game for many industries, including finance and investing – enter the AI financial advisor. They can provide personalized investment advice at a lower cost than traditional human financial advisors. But what are AI financial advisors, and should you use one? This guide lays out the potential benefits, drawbacks, and key considerations.
-
Market Cycle Investing Guide: 4 Stages & 13 Emotions

Understanding the market cycle can seriously boost your investment game – whether you’re in stocks, crypto, gold, or other assets. In this guide, I’ll explain the four market cycle stages and the 13 investor emotions that typically go with them. You’ll also get a blueprint for how to invest (or not invest) within each market cycle stage. So, let’s explore how the market cycle drives investor behavior and asset prices – and what you can do about it.
-
Bitcoin Hash Ribbons Indicator (Explained With Past Results)

The Bitcoin Hash Ribbons indicator, created by Capriole Investments, has given great long-term Bitcoin “buy signals” in the past. It combines the fundamental analysis of Bitcoin mining data with the technical analysis of Bitcoin’s price. In this guide, I’ll explain how the Bitcoin Hash Ribbon works and test its historical accuracy for investors. By the end, you’ll know whether to include the indicator in your own strategy – and how to use it if you do.
-
The Top 10 Personality Traits of the World’s Best Investors
Good investors understand the market and have a clear strategy for success. But the best investors have something extra: the personality traits to win the investment game in the long run. For this post, I’ve researched and listed the top 10 personality traits of some of the world’s best investors (in no particular order). So if you’re wondering what type of behavioral characteristics will help you achieve more financial success, you’ll want to take a page out of each of their books.
-
Pi Cycle Top Indicator Explained: Predict Bitcoin’s Next Top

The Pi Cycle Top Indicator has accurately predicted its fair share of bitcoin tops in the past. The last four times it flashed a “top signal,” bitcoin crashed between 52% and 86%. So in this guide, I’ll explain how the Pi Cycle Top Indicator works, and how to use it to help you potentially spot bitcoin’s next peak.
-
Bitcoin Mining Stock Breakout? WGMI ETF Chart Analysis

Bitcoin mining stocks could be on the verge of a major breakout. The Valkyrie Bitcoin Miners ETF (ticker: WGMI) has been building a giant ascending triangle pattern for almost a year – and that’s now getting close to a resolution.
-
Should You Buy The Coinbase Dip? COIN Technical Analysis
Coinbase stock (COIN) rallied 15% last week – completely erasing its drop from earlier this month. Here’s what I’m seeing in COIN’s price chart right now from a technical analysis perspective.
-
Bitcoin Production Cost Indicator Explained (How To Use It)

The Bitcoin Production Cost Indicator by Capriole Investments can help you decide whether bitcoin is “cheap” or “expensive” from a fundamental perspective. In this guide, I’ll explain how the indicator works and what it says about bitcoin’s value right now.
-
Bitcoin Fibonacci Extension Target: Is $100,000 Fair Game?

Bitcoin is trading well above its last bull market peak of $69,000 – set in the glory days of November 2021. But what’s a reasonable price target for this bull market? If we take a bitcoin Fibonacci extension, $100,000 a coin seems fair. Here’s what you need to know.
-
Chinese Stocks Could Be A Bargain: MSCI China Ratio Analysis

The MSCI China Index tracks the performance of almost 800 Chinese stocks. And right now, it could offer better value than stocks of the MSCI World Index, and similar indices for the US, Japan, UK, Europe, and emerging markets. Per the chart below, China has the lowest price-to-earnings (P/E), forward price-to-earnings (Fwd P/E), and price-to-book (P/B) ratios of the bunch.
-
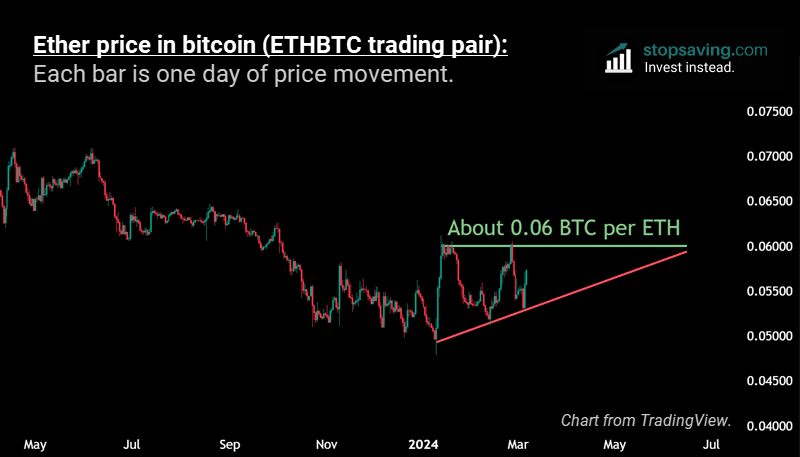
ETHBTC Analysis: Ascending Triangle & ETF Deadline Breakout?

If you’re pondering whether Ethereum or Bitcoin will do better this year, take a look at this chart. It shows a potential ascending triangle forming for ether priced in bitcoin (aka the ETHBTC trading pair). If it breaks to the upside, you could expect ether (ETH) to outperform bitcoin (BTC) for a while.
-
How To Earn Passive Income From Crypto Staking (3 Methods)

Einstein said that compound interest is the 8th wonder of the world. If he were still around today, he’d probably call staking the 9th. But what is crypto staking exactly, and how can it transform your digital investments into a source of passive income? In this guide, I’ll explain what staking is and how it works. I’ll then compare three ways that you can stake your own coins and tokens to make your crypto work harder for you. We’ll go from complete beginner staking options to the highly advanced.
-
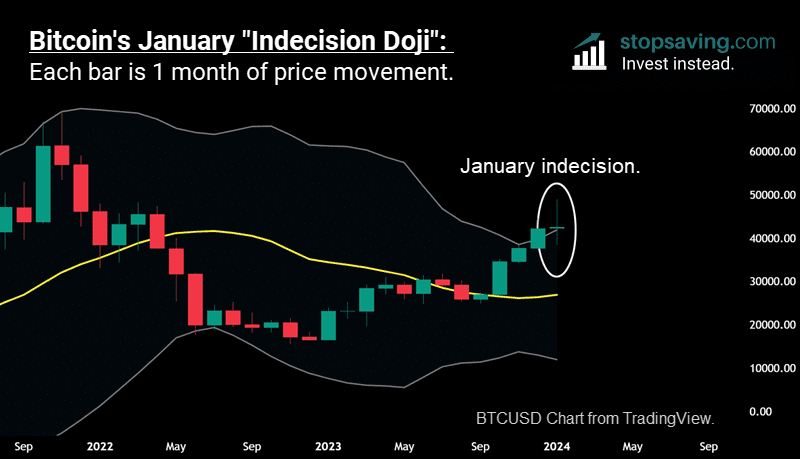
Bitcoin Closed January With An Indecision Doji (What It Means)
If you’d bought bitcoin at exactly the start of January, then sold it at exactly the end of January, you would’ve made just under 1% on your investment. But in that month, you would’ve been whipsawed around (a lot). On January 11th (Bitcoin ETF launch day), you were up around 15% for the month. Then on January 23rd, you were down about 9%. With all that volatility and no real decision in the end, bitcoin closed January with a “long-legged indecision doji” candle. In this post, I’ll explain what that is, and what it could mean for bitcoin over the next few months.
-
Last Week’s S&P 500 All Time High: A Different Perspective

The US stock market has officially recovered from the 2022 bear market – with a new S&P 500 all-time high. The index tracks the growth of the 500 biggest stocks in the US. Last week, it finished trading at just under 4,840 points – about 20 points above its peak in January of 2021.
-
Are Bitcoin Mining Stocks Worth The Risk?

If you’re looking to dabble in bitcoin mining stocks, this chart can give you some idea of their risk versus bitcoin. It shows what would’ve happened if you’d invested $100 in the Valkyrie Bitcoin Miners ETF (WGMI, green) when it first started trading on the Nasdaq in February of 2022. Compare that with the “steadier” pure bitcoin investment in blue.
-
The Bitcoin Fibonacci Rejection: 1 Point To The Bears
Despite all the ETF hype last Thursday, bitcoin has been “rejected” at a major technical price target: the 0.618 “golden” Fibonacci retracement level. In the past, this has led to more downside for bitcoin. Of course, history doesn’t have to repeat itself here. But if you’re looking for a reason to be cautious, this is one of them. Let’s jump in.
-
Ethereum ETF: The Next Rumor To Buy After SEC Hack?

Yesterday’s fiasco involving the SEC, Twitter (X), and Bitcoin ETFs has revealed where crypto investors might flock to next: Ethereum. Here’s a breakdown of what happened, and why the Ethereum ETF could be crypto’s next big trade.
-
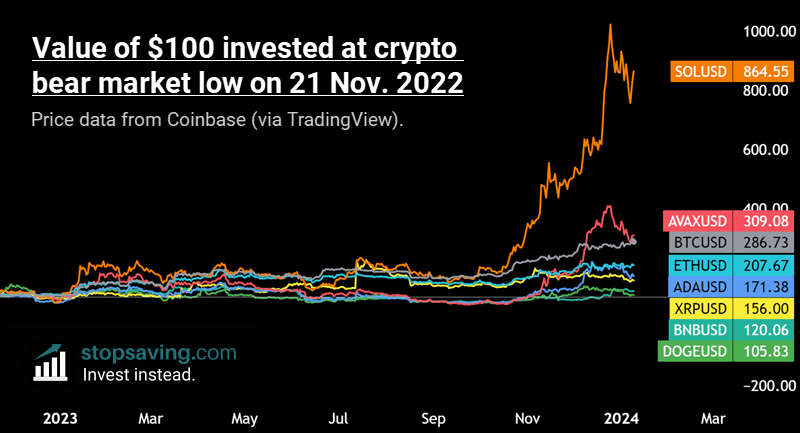
Solana Has Led The Crypto Bull Run With Relative Strength

Since bitcoin bottomed on November 21st of 2022, Solana has shown relative strength compared to other “blue chip” crypto assets. Per this chart, if you’d invested $100 in Solana (SOL) back then, it would be worth around $860 today. It’s beaten the rest of the pack by miles. As for what this might mean for your crypto portfolio, here are three (long-term) strategies to consider.
-
Will The Bitcoin ETF Be A “Sell The News” Event?
There’s a fair chance the US Securities and Exchange Commission (SEC) will approve one or more spot Bitcoin Exchange Traded Funds (ETFs) this week. This would be major news for bitcoin. So naturally, investors are speculating whether the ETF approval could be a “sell the news” event. Here’s what you need to know.
-
The Bitcoin Pullback Could Be Over (For Now)
The past two weeks haven’t been great for bitcoin. Its price dropped by about 10% from a high of just under $45,000 a coin to a low of just above $40,000. But Monday’s price action suggests that the bitcoin pullback could be over for now. And the bullish uptrend is more likely to continue than not.
-
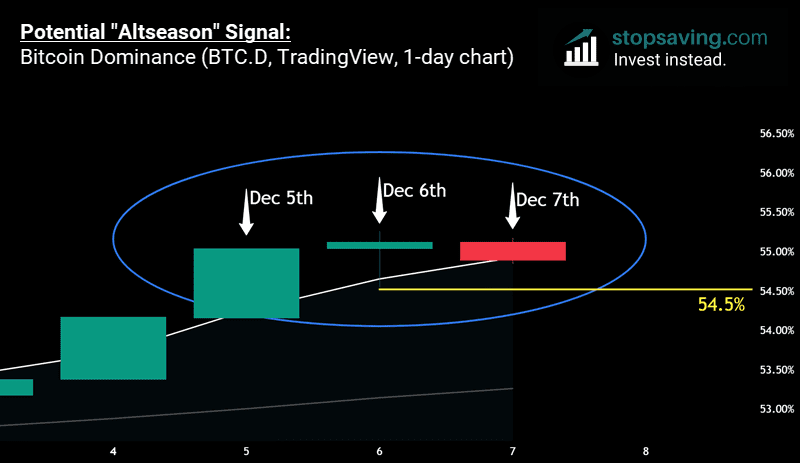
Crypto Alert: Watch for This Altseason Indicator’s Next Move

Bitcoin has been stealing the crypto show with its recent rally – with most “altcoins” falling behind the king. But at some point bitcoin will start to slow down. And history suggests this might give the rest of the crypto market a brief window to catch up. The question is when? When can we expect a glorious “altseason”, where Ethereum and other altcoins outpace bitcoin? Here’s a potential altseason indicator that might fire off soon.
-
Bitcoin Is Riding The Bands Of A Bull Market

Bitcoin is doing something it only does in major bull runs: riding the top Bollinger Band on the weekly time frame. Here’s a quick explanation of what it means and why it’s incredibly bullish for bitcoin – until it isn’t.
-
Will Altcoins Fly Or Falter This Christmas?
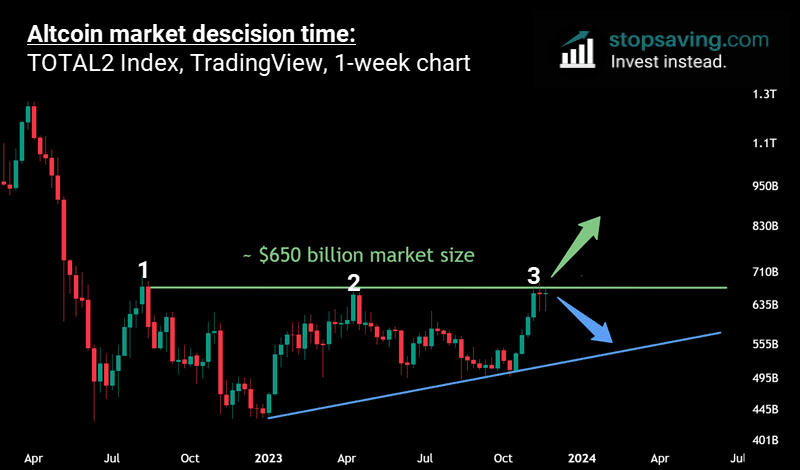
A golden rule of trading is that you don’t get bullish at resistance. And right now, the altcoin market is hovering around a massive resistance level (green line). This chart shows the weekly price candles of the TOTAL2 index, which essentially measures the total market size of crypto without bitcoin. The index is now on its third attempt to break above the $650 billion dollar mark.
-
Crypto Swing Trading Strategy Explained: 5 Key Rules

There’s swing trading, and there’s crypto swing trading. In this guide, I’ll explain how to swing trade the world’s most volatile asset class – with 5 key rules I’ve learned from trading it since 2017. You’ll get the hard-earned lessons without the hard knocks.
-
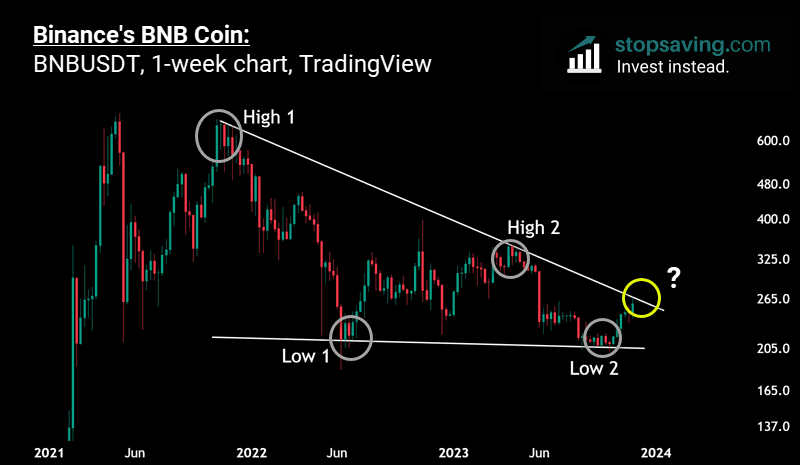
Is Binance’s BNB Coin About To Jump Over Its Legal Hurdles?

Binance (the world’s biggest crypto exchange) is in talks with the US Department of Justice (DoJ) to settle a year-long criminal investigation by paying over $4 billion in fines. That’s a lot of money, but Binance can probably afford to fork it out.
-
Coinbase Breakout Level: 3rd Time Lucky For COIN?

Coinbase (COIN) has been a key beneficiary of this year’s crypto rally – with the stock price up over 200% off its lows. But for all its strength, it’s struggled to crack through the $100 ceiling. With the stock ending last week at $99.05, this will now be its 3rd attempt (grey circle, in the chart). So, is a Coinbase breakout still in the cards?
-
Dogecoin Price Analysis: Getting Its Bark Back?
Altcoins have seen some mega rallies lately. But Dogecoin – usually one of the most speculative of them all – hasn’t had a “proper run” just yet. Sure, it’s up around 50% this quarter. But that’s hardly the FOMO levels it’s commanded in the past.
-
Ethereum vs Bitcoin: What’s A Better Investment Right Now?
Bitcoin is up about 120% this year, while Ethereum is “only” up 70%. But over the past 3 weeks, Ethereum has started to steal bitcoin’s thunder – beating it by about 7%. This begs the question: Ethereum vs bitcoin, which is better bang for your buck right now? So in this article, I’ve compared them based on 3 key criteria to help you decide for yourself.
-
2 Reasons Why $38,000-ish Is A Major Bitcoin Price Target

The bitcoin price reached as high as $38,000 last week. But since then, the rally has lost some steam. And that might be because the $38,000 region is a major bitcoin price target for technical traders. Here are two reasons why.
-
Solana is halfway back to its all time high: Don’t FOMO

Solana has been one of the best-performing digital assets this year. SOL has rallied about 500% since its $8 low last December – meaning it’s now recovered more than half its bear market losses. From here, Solana would need to see a similar percentage gain to reclaim its previous all-time high of $260 (November 2021).
-
Why Is The Grayscale Bitcoin Trust Doubling Bitcoin This Year?

The Grayscale Bitcoin Trust (GBTC) is up almost 250% this year – but bitcoin itself is only up half that. Let’s unpack what’s going on here.
-
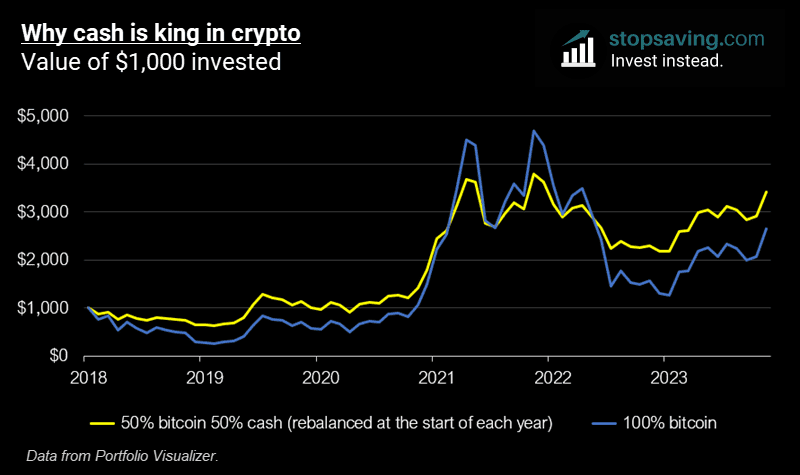
Why Cash Is King In Crypto
“Cash is king” is a popular saying in investing. The idea is that cash gives you the resources to buy cheap investments – which could pay off over time. And this chart shows why that might be true when investing in bitcoin.
-
Is Coinbase a Good Investment? In-Depth COIN Stock Analysis
Coinbase (ticker: COIN) started trading on the NASDAQ on April 14, 2021. The stock price reached an all-time high that day of $428 – but it currently trades for less than $100. Last Thursday, the crypto exchange released its third-quarter earnings report. So, I’ve gone through it with a fine tooth comb to check if Coinbase is a good investment right now. Here’s what I found.
-
Mutual Fund vs ETF: Which is A Better Investment For You?

Mutual funds and exchange-traded funds (ETFs) each let you own a mix of investments – without having to buy lots of investments at once. This makes both of them great options for diversification. But if you’re racking your brain trying to choose which option is better for you, this guide’s got you covered. Let’s jump in.
-
Long Bitcoin, Short The Banks? Not So fast…

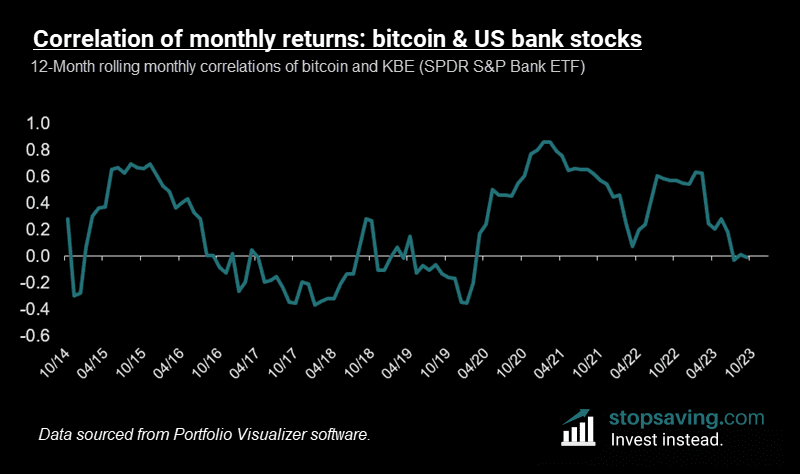
The SPDR S&P Bank ETF (KBE) is an exchange-traded fund that invests in American banks and other financial services companies. KBE is so far down over 20% this year, while bitcoin is up over 100%. As you’d expect, cries to “long bitcoin, short the banks” have now grown louder. But if you’re a long-term investor trying to build a diversified portfolio, this chart might suggest a different view: to buy them both.
-
3 Types of Chart Patterns That Traders Should Understand
Chart patterns can be effective tools for traders and investors. They can help you decide when to buy, sell, or sit tight with an investment. But if you search “chart patterns” in Google, you’ll find hundreds of different variations. So in this guide, we’ll break them down into just three basic types: bottoming patterns, topping patterns, and compression patterns. Let’s jump in.
-
Bitcoin Barbell Strategy Explained: Muscle Up Your Portfolio

There’s a lot to be said about spreading your investment portfolio across many different baskets. But the barbell strategy takes a different approach. It splits an investment portfolio into just two weights on either side: the “risky” side (stocks) and the “safe” side (bonds). In this post, I’ll explain how the barbell strategy might work when one of those sides is bitcoin.
-
Beware The Bitcoin ETF Launch Date

The bitcoin price made a fresh yearly high yesterday of around $35,000. This comes as more investors expect the first physically-backed bitcoin ETF (exchange-traded fund) to be approved by the US regulator. We don’t know exactly when it will be approved, but it could be anything from a few days to a few months out. Yet, bitcoin’s recent rally suggests an ETF approval might come sooner rather than later.
-
Chainlink Breaks 1.5-Year Trading Range. Now what?
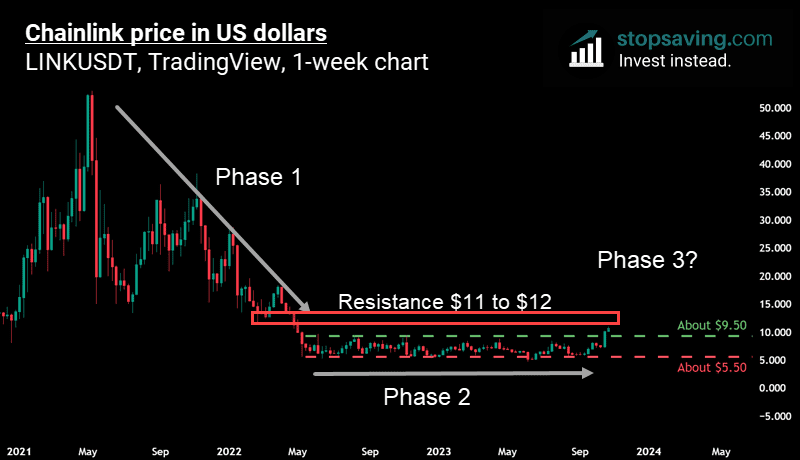
This chart shows the price of Chainlink’s LINK token over the past few years. After dropping by about 90% in Phase 1 (May 2021 to May 2022), the price ranged sideways for about 18 months (Phase 2). But last week, LINK finally broke above the top of that range, ending yesterday just above $10 a token.
-
How To Invest For Retirement: A 7-Step Guide
Whatever your age, it’s important to plan ahead and invest for retirement. Here’s a 7-step guide to help you retire in style.
-
US Treasury Bonds: 3 Reasons To Consider Buying Them Now

US treasury bonds have been under pressure lately. The iShares 20 year+ treasury bond ETF (TLT) is down about 35% since the US Federal Reserve (Fed) started raising interest rates in March of 2022. TLT tracks the price of US treasury bonds – or American government bonds that take 20 to 30 years to mature. And here are 3 reasons why now could be a good time to add them to your portfolio.
-
Gold Price Analysis: Bear Trap In The Making?

Gold bugs haven’t had much to celebrate this summer, with the gold price slowly bleeding out since May. But this week has (so far) seen gold up about 4%. Most of this rally happened after US inflation numbers came out Wednesday. At 3.7%, the consumer price index (CPI) number was slightly hotter than the 3.6% analysts expected. And there could now be a classic gold “bear trap” in the making.
-
Is The Nasdaq’s “Dip” Already Over?

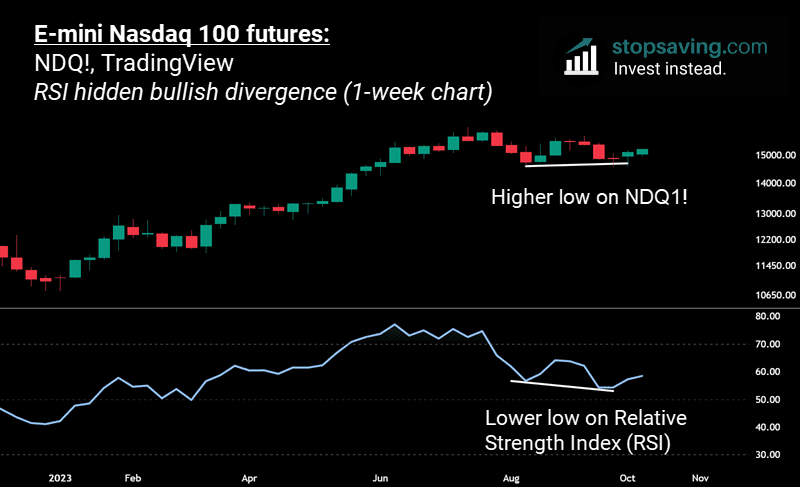
The Nasdaq 100 index (which mostly tracks US tech stocks) rallied an impressive 50% in the first half of this year. But it’s been losing points in the second half – and is down about 5% since its peak in July. This recent “dip” has had the gloom and doom brigade shouting for much lower prices in the US tech sector. Sure, there are economic issues afoot that could make that happen. But this chart suggests the dip might already be over.
-
Bitcoin Halving Explained: 5 Things Investors Must Know
The 4th Bitcoin halving will happen in April 2024. It’s a big deal for bitcoin and the rest of the crypto market. In this guide, we’ll outline 5 things investors should know about the halving. We’ll start off by explaining what the halving means for Bitcoin (the blockchain, with a big “B”). We’ll then shift the focus to what it could mean for the price of bitcoin (the digital currency, with a small “b”). Let’s jump in.
-
The Altcoin Market Might Not Be In A Downtrend After All
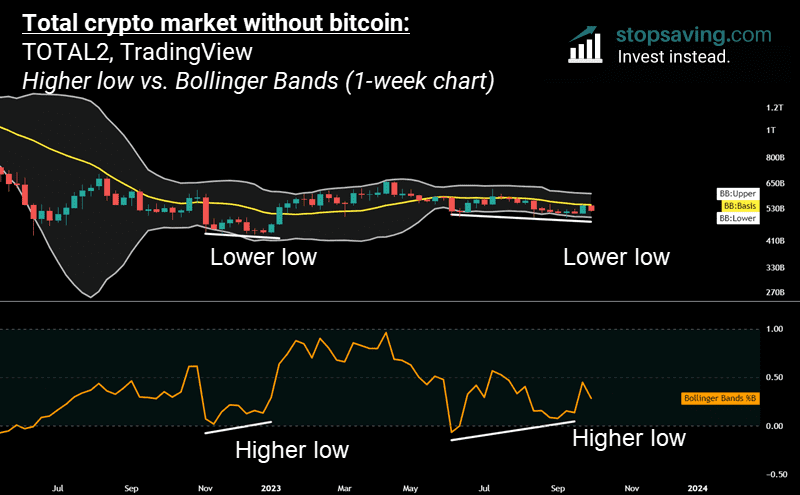
The red and green bars in this chart show the week-to-week movement of the TOTAL2 Index. TOTAL2 is a general proxy for the performance of the altcoin market – i.e. crypto excluding bitcoin. After rallying 50% in the first quarter of this year, the index has slowly drifted down. It’s been in a technical downtrend since April.
-
How To Value Bitcoin (10 Methods Simply Explained)

Bitcoin’s price moves around a lot. But as crypto-skeptic Warren Buffett once said: “Price is what you pay, value is what you get.” In this guide, you’ll learn how to value bitcoin using 10 different methods. These can help you decide whether bitcoin’s current price is cheap or expensive relative to its value. So, here are 10 ways to value bitcoin (in no particular order).
-
Bitcoin Technical Analysis Update (3 Charts)
The bitcoin price jumped about 6% higher over the weekend – ending the week at just under $28,000 a coin. This level is also about 13% above its September low of around $24,800. Here are 3 bitcoin charts I’m looking at right now to see if this move is sustainable.
-
3 Things Every Crypto Investor Should Do Right Now
Crypto is incredibly dull right now, but this is not the time to get complacent. So, here 3 things every crypto investor should be doing.
-
Supertrend Indicator: Good For Timing Bitcoin?
The supertrend indicator is touted as a top tool for spotting the trend of an investment. In this guide, you’ll learn what it is, how it works, and whether it’s any good for timing bitcoin’s moves.
-
Is Solana A Good Investment? A Plain English Guide
Investing legend Peter Lynch once said: “Know what you own, and know why you own it”. So if you’re wondering if Solana is a good investment, this guide’s got you covered. First, we’ll focus on understanding what Solana is and how it works. We’ll then explore its potential long-term investment case. So, let’s jump in.
-
Bitcoin’s Bullish Engulfing Candle (1 Point to the Bulls)
This chart shows the weekly price movements for Bitcoin since mid-August. As you can see, “Candle 2” (which ended last week Sunday) was the first green candle of the bunch. But more interestingly, it was a bullish engulfing candle.
-
Keeping It Simple: Ethereum Ascending Triangle
When it comes to technical analysis, there’s a lot to be said about keeping things simple. And this Ethereum ascending triangle is about as simple as it gets for most crypto traders. It’s a weekly chart – meaning each red or green bar represents one week of price movement. This way, the chart cuts out the short-term noise to focus on the bigger trade.
-
RNDR Token Guide: 5 Things Investors Should Know

RNDR token has been one of the top-performing cryptos of 2023 so far. So if you’re considering it as a potential long-term investment, this guide has 5 things you should know.
-
Two Reasons To Sell Nvidia (And One Reason Not To…)
Unless you’ve been living under a rock, you’ll know that Nvidia’s been one the best investments of 2023 so far. The AI chip maker’s stock is up over 200% this year, and over 300% since it bottomed last October. But for the contrarian investor, there could be two reasons to sell Nvidia over the coming months (or at least, take some profits…).
-
What To Do About The Bitcoin Drop
Bitcoin has dropped about 20% since July, when it was just under $32,000 a coin. But with the price now trading closer to $25,000, you might be asking yourself what to do. So here are three things to consider about the bitcoin drop.
First, A closer look at bitcoin’s technicals
Let’s break down bitcoin’s weekly chart. Each bar you see represents one week’s worth of price action. By looking at it this way, we can get a clearer view of bitcoin’s longer-term trend – minus the daily distractions.
-
MVRV Z-Score Guide: Decoding Bitcoin’s Value

Want to know if Bitcoin is a good buy or too expensive? The MVRV Z-Score can help. It’s a useful indicator first developed by David Puell and Murad Muhmudov that uses info from Bitcoin’s public transactions on the blockchain to find its “fair value”. In this guide, we’ll learn what the MVRV Z-Score is, how it works, and how to use it to check if Bitcoin is currently a buy or not.
-
An Investor’s Guide To Ethereum And Ether
Ethereum is the second biggest digital asset behind bitcoin – and for good reason. In this guide, I’ll explain what Ethereum is, how it works, and why ether (ETH) belongs in most crypto portfolios.
-
A Bitcoin Head And Shoulders Pattern Is Forming…
There’s a bitcoin head and shoulders pattern forming. It’s a bearish technical pattern, and you can see it brewing on this chart. It first shows the left shoulder, where bitcoin peaked in late April at around $29,300. It then shows the head in the middle, where bitcoin topped at $31,000 in mid-April. And finally, there’s the right shoulder, where the price got to about $30,000 in late April before heading down to where it is now.
-
Best Investment Books Of All Time: My Top 10 List
Benjamin Franklin said it best: “An investment in knowledge pays the best interest”. And whether you’re a seasoned pro or just starting out, reading the best investment books can pay big dividends later. So, I’ve put together a list of my top ten (in no particular order). Together, they cover everything from the basics to more advanced investing strategies. I’ve also included an interesting quote from each book that got me thinking. So without further ado, here’s the list!
-
What The Failure of First Republic Bank Says About Bitcoin
First Republic Bank has failed. Its shares stopped trading before US markets opened on Monday after regulators seized the firm. It’s the second biggest regional bank failure in US history, and here’s what it says about bitcoin.
-
Solana Has Reclaimed Its 200-Day Moving Average

If you’re looking for a decent risk-to-reward technical setup in the crypto market, Solana seems like as good a bet as any to me.
-
Silver’s A Bargain, According To The Gold To Silver Ratio
Gold’s pretty much trading at all-time highs. Silver’s only halfway there. The gold to silver ratio says silver’s a bargain. Let’s dig in.
-
Ray Dalio And The All Weather Way Of Investing

Ray Dalio founded Bridgewater Associates, one of the world’s biggest hedge funds with over $200 billion of assets under management. Bridgewater is famous for its All Weather Fund, which it built to weather any economic season. So let’s take a closer look at how Dalio invests, and how you could do something similar in your own portfolio through a basket of ETFs.
-
Why It Does Not Pay To Sell In May
“Sell in May and go away” is a popular phrase in investing: the idea is to exit stocks in May and then buy them back in November. But even though that might work out sometimes, history suggests it isn’t the best strategy for building long-term wealth. Here’s why.
-
They Don’t Call Them Growth Stocks For Nothing
If you’d invested $10,000 in the Invesco QQQ Trust ETF (QQQ, blue) ten years ago, you’d be sitting on just over $50,000 right now. QQQ tracks the Nasdaq 100 index, which currently has almost 50% in the high-growth US tech sector. But if you’d put that money in the iShares Russell 1000 Value ETF (IWD, yellow), you’d only have about half that. So over the past decade, value stocks have generally taken a back seat to growth stocks.
-
Bitcoin Dominance Is Losing Steam. Altseason Coming?
Bitcoin’s reigned supreme this year and almost doubled in value since its November low. For the most part, it’s outpaced the rest of the crypto market – with altcoins generally lagging behind. But this bitcoin dominance chart suggests that could be changing. Is the king finally stepping back to let the knights and nobles catch up?
-
An Investor’s Guide To Bitcoin
Bitcoin was the fastest investment in history to go from zero to $1 trillion in market value. And it did it without a CEO or board of well-paid executives steering the ship. So what exactly is Bitcoin and how does it work? We’ll break it down for you in this guide – and explain why you might want some in your investment portfolio.
-
Bitcoin’s Having A Bollinger Band Squeeze: Big Move Ahead.
Yesterday bitcoin didn’t do much: it finished up just 0.02% from where it started. And over the past couple of weeks, it’s mostly hovered within a narrow 5% range. But this chart shows another Bollinger Band squeeze in the works (blue circle). And that suggests bitcoin’s next big move is coming soon.
-
Bitcoin Will Have A Big Drop At Some Point. But At What Price Level?
Bitcoin is on a rally of epic proportions. But at some point, it’s going to pull back in a big way. The question is at what price level? This chart might offer some clues.
-
Should You Ditch The 60:40 Portfolio For This Alternative?
The 60:40 portfolio is a popular strategy for investors who want a good tradeoff between risk and reward. But there’s probably a better one for that – and I’ll explain it in this post.
-
Why Now Might Be The Time To Get Into Altcoins
Most digital assets haven’t kept up with bitcoin this year. But for contrarian crypto investors, now could be the time to spread your bets into a mix of stronger altcoins. Here’s why.
-
Gold or Bitcoin, Which Is The Better Investment?
Gold or bitcoin? It’s a question you might ask yourself in this economic climate. One is a store of value from Ancient Babylonian times. The other is modern, digital, and mathematically programmed to get scarcer by the day. Both can’t be debased like fiat currencies. Gold bugs hoard gold. Bitcoiners HODL bitcoin. Both cost money to mine. Which is the better investment?
-
Here’s What Ethereum’s Shanghai Upgrade Means For Ether
The folks over at Ethereum just announced it: the Shanghai upgrade is set for 22:27:35 UTC on April 12, 2023. It’s a big deal for the No.2 blockchain that could have big implications for the price of ether. So here’s what you need to know.
-
A Rare Buy Signal Just Flashed For US Stocks

With so much economic uncertainty afoot, you might be wondering whether stocks can still go the distance this year. So I used ChatGPT-4 to help me program and backtest a long-term investment strategy in TradingView. And it’s just flashed a rare buy signal for US stocks.































































It is a long established fact that a reader will be distracted by the readable content of a page when looking at its layout. The point of using Lorem Ipsum is that it has a more-or-less normal distribution of letters.
It is a long established fact that a reader will be distracted by the readable content of a page when looking at its layout. The point of using Lorem Ipsum is that it has a more-or-less normal distribution of letters.


There are many variations of passages of Lorem Ipsum available, but the majority have suffered alteration in some form, by injected humour, or randomised words etc.
- There are many variations of passages
- Lorem Ipsum available, but the suffered
- There are many variations of passages
- Lorem Ipsum available, but the majority
- There are many variations of passages
- Lorem Ipsum available, but the suffered
- There are many variations of passages
- Lorem Ipsum available, but the majority
- There are many variations of passages
- Lorem Ipsum available, but the suffered
- There are many variations of passages
- Lorem Ipsum available, but the majority