

Is Binance’s BNB Coin About To Jump Over Its Legal Hurdles?
Binance (the world’s biggest crypto exchange) is in talks with the US Department of Justice (DoJ) to settle a year-long criminal investigation by paying over $4 billion in fines. That’s a lot of money, but Binance can probably afford to fork it out.
Is a possible settlement good for Binance (and BNB coin)?
Nobody likes coughing up cash to the DoJ. But let’s face it, a settlement would stop a “worst case scenario” from happening. Binance could likely still operate in the US – the world’s biggest financial market, and founder Changpeng Zhau (CZ) could avoid possible jail time. The settlement would provide legal clarity and certainty for Binance to move forward (after a big slap on the wrists).
Keep in mind that Binance still has other legal battles to fight besides the DoJ. It’s being sued by the US Securities and Exchange Commission (SEC) for violating a bunch of securities laws. The Commodity Futures Trading Commission (CFTC) is also going after the exchange on the derivatives front. But if Binance’s lawyers are good enough to settle with the DoJ, they can probably settle with the regulators as well. You can read more about Binance’s legal woes here.
What’s the BNB price chart saying?
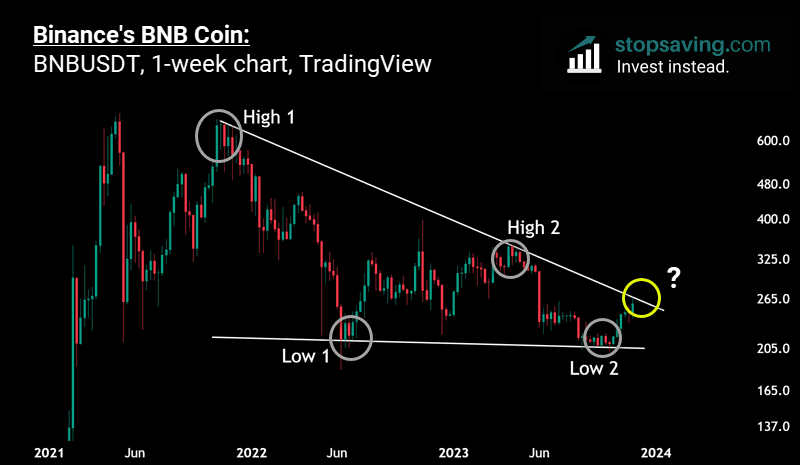
Legal speculation aside, let’s now analyze BNB’s price chart to see where its price might go next. Each red or green bar in the chart represents one week of price movement for BNB. As usual, I’ve drawn this in logarithmic scale to focus on the percentage moves rather than the number moves. I’ve then (roughly) connected the lows and highs over the past two years and viola – a falling wedge pattern.
A falling wedge is technically a bullish pattern. Here, sellers push the price down to form the top of the wedge. Notice how “High 1” (November 2021) was much higher than “High 2” (April this year). Buyers then bid the price back up to form the bottom of the wedge. But this time, “Low 1” (June last year) was only slightly higher than “Low 2” (September this year). In other words, the force with which sellers knocked the price down got weaker each time. Ergo, buyers are getting relatively stronger versus sellers – according to the pattern.
Is BNB a buy?
BNB is now brushing up against the top of the wedge (yellow circle), and there’s a “question mark” over what happens next. If BNB can close this week above the top of the wedge (around $275 dollars by my calculations), you’ll probably see it trend higher over the coming months – albeit with massive volatility along the way. According to technical analysis theory, the target for a falling wedge breakout would be somewhere near the top of the wedge. That’s about $650 in the long run.
But let’s not get too ahead of ourselves just yet. The “question mark” could also turn into “High 3” – in which case, you might get a better buy entry lower down…
Disclaimer: This is not investment advice. I don’t own any BNB right now. But I might look to swing trade it depending on how things play out. If you liked this quick update on BNB coin, don’t forget to sign up for our weekly newsletter here!


