Bitcoin RSI Bullish Divergence Builds the Bottom Case
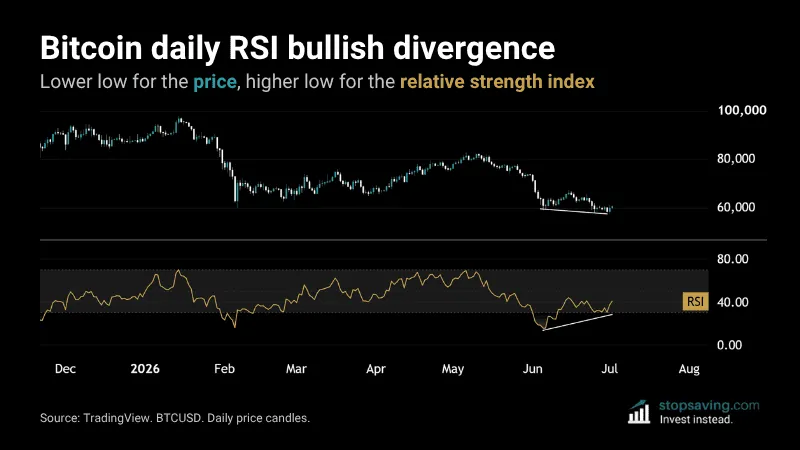
A bullish RSI divergence signals that sellers are losing power – even while the price keeps drifting lower. Bitcoin’s daily chart just made one. The price dropped to $59,081 on June 5, then made a lower low of $57,737 on July 1. But the RSI did the opposite: it made a higher low in that time.
What the daily bitcoin RSI bullish divergence tells us
The RSI (relative strength index) scores the battle between buyers and sellers on a scale of 0 to 100. Each day, it looks back at bitcoin’s last 14 trading days. When the up days are bigger than the down days on average, the scorecard rises in favor of the buyers.
The RSI bottomed at around 15 on June 6 – one day after the bitcoin price low. It held above that level through the July price low, and now reads about 40. So the leg down to $57,737 had less muscle behind it than the one before. The sellers still won the round – but the buyers got stronger, according to the RSI indicator.
That’s the bullish divergence. And it often shows up when a downtrend is about to reverse.
Zooming out to bitcoin’s weekly RSI
As I wrote in February, bitcoin’s weekly RSI hit one of its most oversold readings ever. The price rallied to around $80,000 by May. The Wyckoff spring I covered in mid-June didn’t quite hold, but the $60,000 area did. And the weekly RSI is now far above its February low, but the price candles are lower.

But the weekly RSI bullish divergence isn’t technically “confirmed” just yet. Bitcoin would first need to actually make a weekly low. That’s in the cards if bitcoin can close the week above about $63,000 – near last week’s open.
Market bottoms are built one divergence at a time. For now, the daily RSI divergence needs to do the work before the bigger trading time frames take over.
As usual, none of this is investment advice. To learn how to use the RSI in your investment strategy, check out our RSI Explained guide.