RSI vs Stochastic RSI: Which Should You Use?
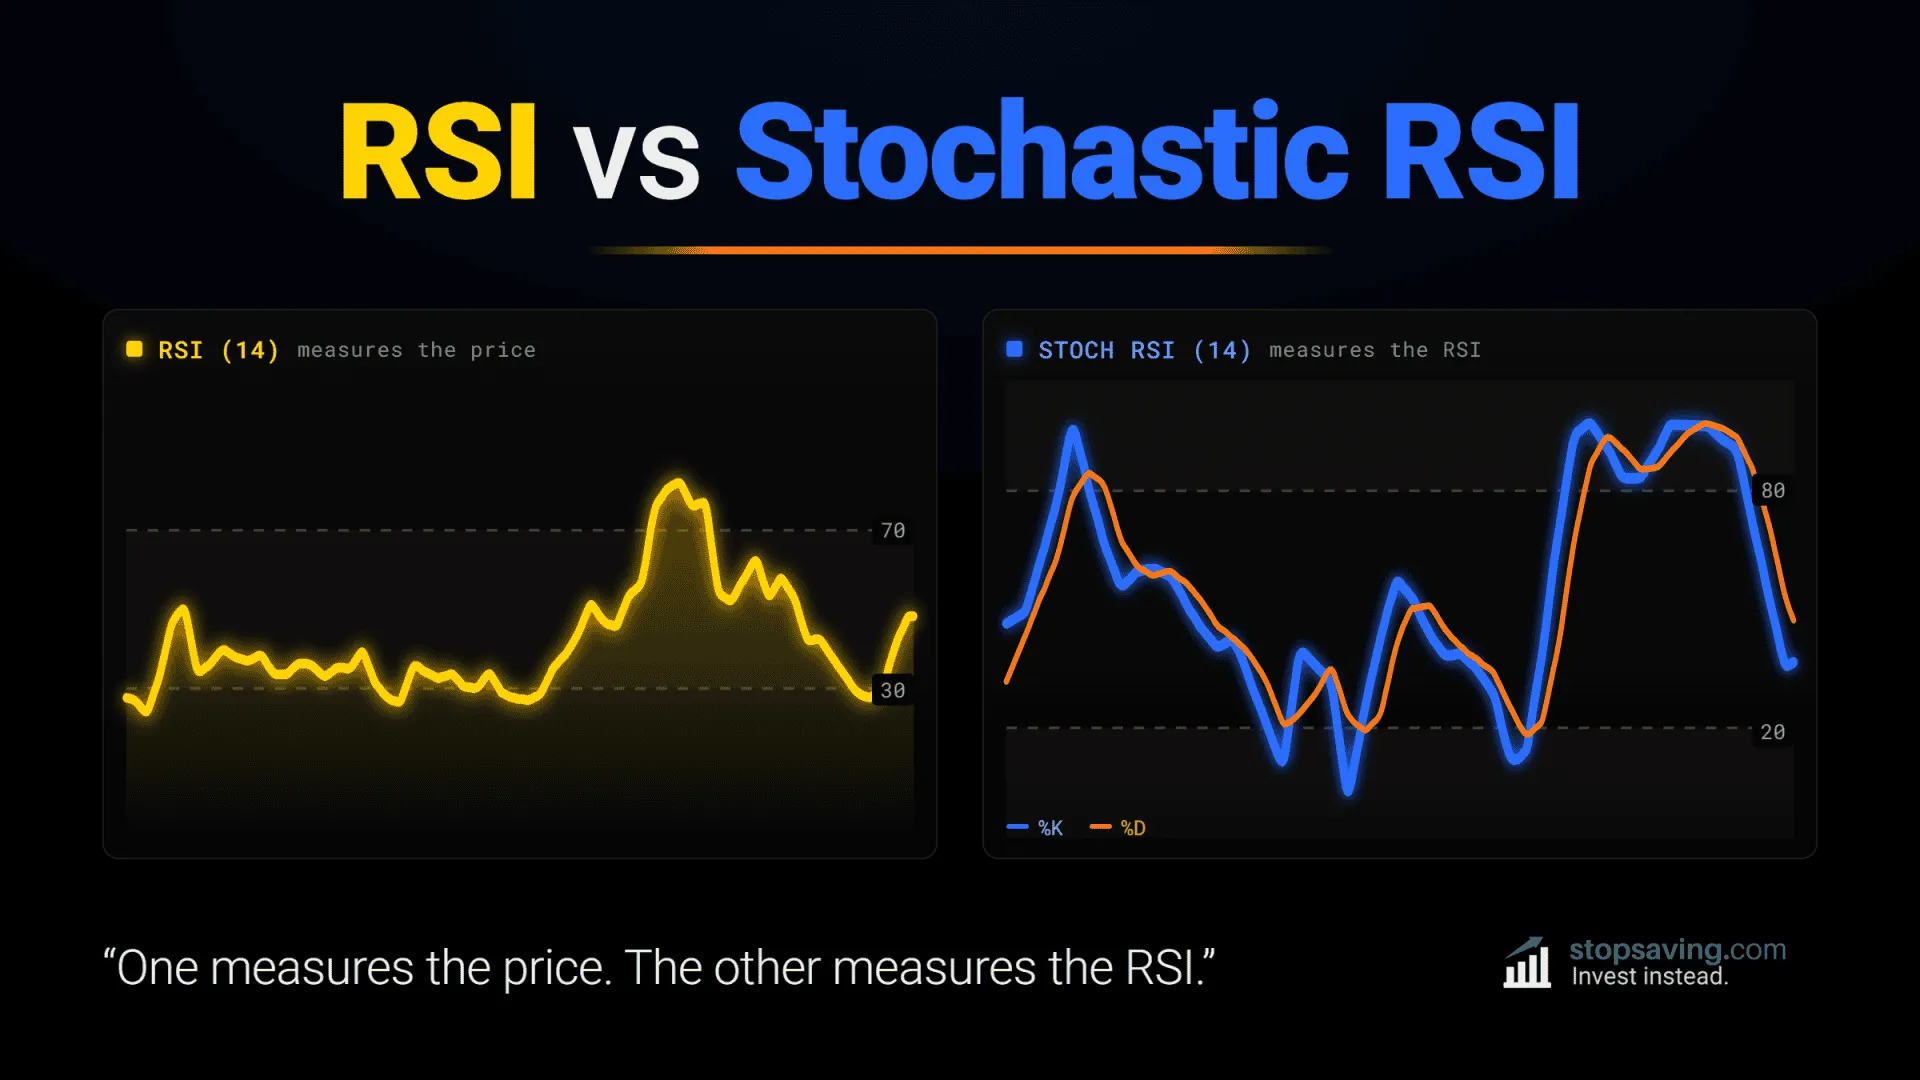
The relative strength index (RSI) measures the momentum of an investment’s price. The Stochastic RSI measures the momentum of the RSI itself. That one difference decides everything else.
Momentum is how much strength is behind a price move. The RSI tracks it slowly and steadily. The Stochastic RSI exaggerates every twitch in the RSI – so it tends to swing between extremes more often, with more false alarms.
Here’s how the two indicators compare, and how to choose the right one for your trading or investment strategy.
What the relative strength index (RSI) measures
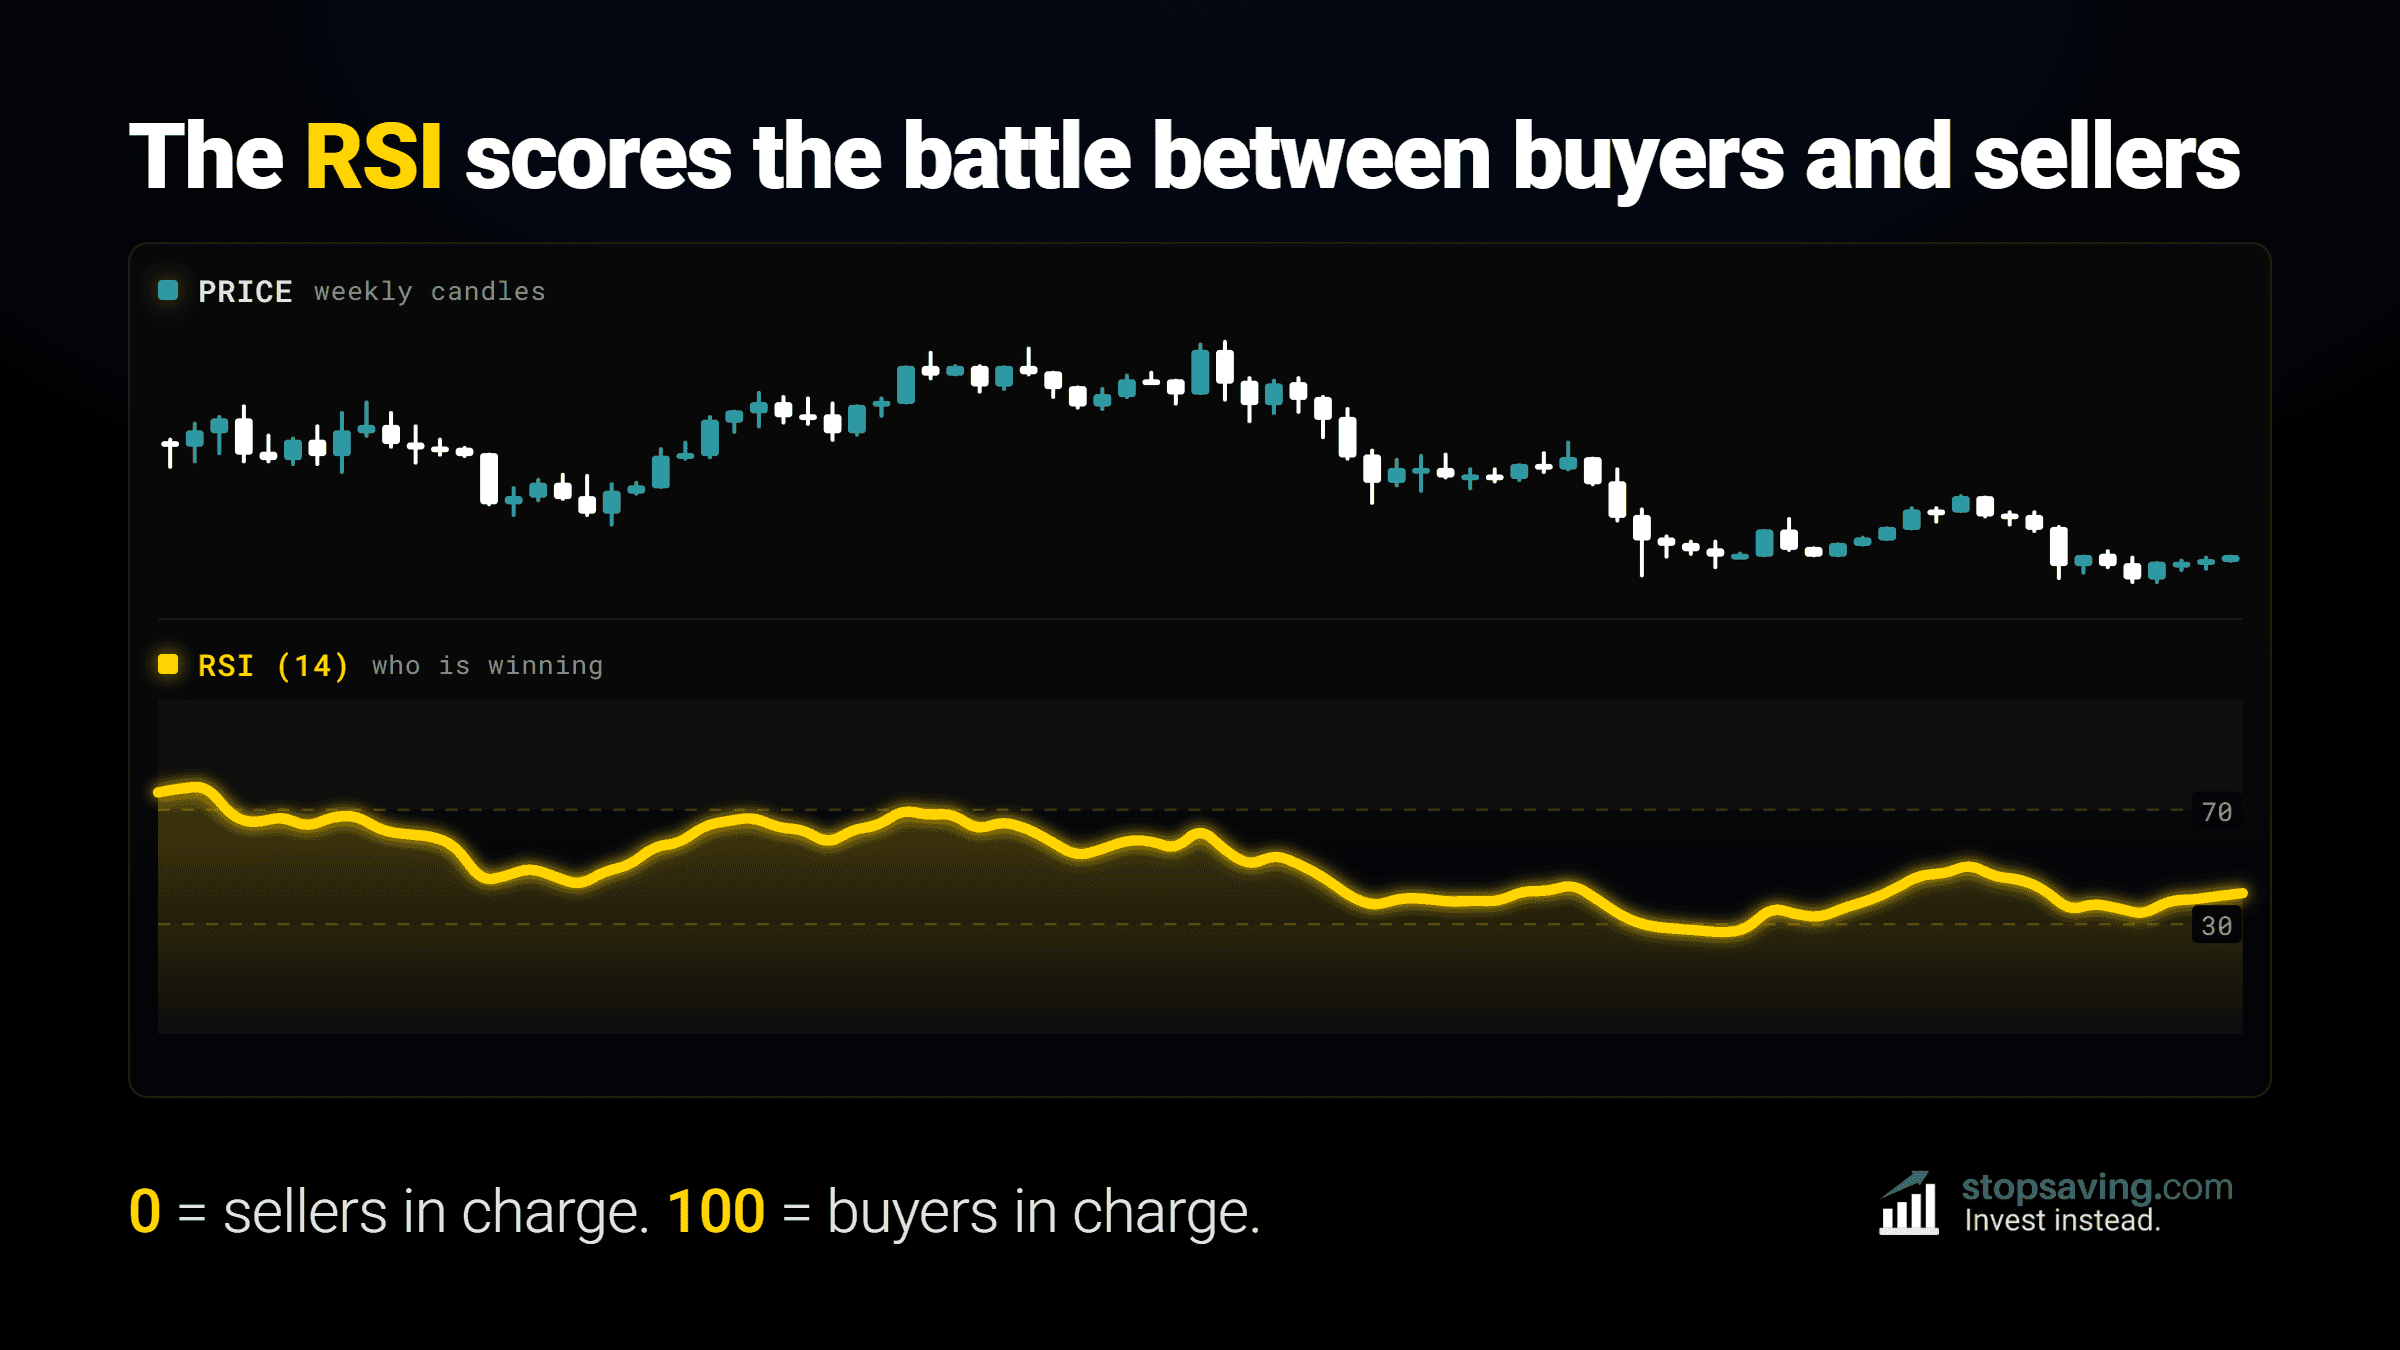
J. Welles Wilder Jr. introduced the RSI in 1978. It measures the balance of power between buyers and sellers over the past 14 trading periods. Those periods can be hours, days, or weeks – it depends on your trading time frame.
The RSI then scores that balance between 0 and 100:
- Closer to 100: buyers are winning. Above 70 is “overbought” – buyers control the trend.
- Closer to 0: sellers are winning. Below 30 is “oversold” – sellers control the trend.
One thing often catches beginners out: an overbought RSI is not an automatic sell signal. (A trading signal is simply a chart clue that suggests it might be time to buy or sell.) Strong uptrends can keep the RSI above 70 for months. The trades most traders actually take from the RSI come from divergences – more on those below. Our RSI guide gives you the full spiel on that.
The Stochastic RSI is a derivative of the RSI
The Stochastic RSI is what you might call a derivative indicator – not the calculus kind, the finance kind. A financial derivative gets its value entirely from something else, like an option that derives its value from a stock.
The Stochastic RSI works the same way. First the price feeds the RSI, then the RSI feeds the Stochastic RSI. So it’s an “indicator of an indicator” – everything it tells you comes from where the RSI is within its own recent range. You’ll often see it shortened to “Stoch RSI” in trader lingo.
Tushar Chande and Stanley Kroll built the Stochastic RSI in 1994. They wanted to fix a specific problem: the RSI can drift through the middle of its range for months without going overbought or oversold. So, traders got fewer “extreme” readings to act on.
Their fix was to stop scoring the RSI on the 0 to 100 scale – and score it against its own recent highs and lows instead. Say the RSI has ranged between 50 and 65 over the past 14 days. If today’s RSI is 65 (the top of that range), the Stochastic RSI reads 100. If it’s 50, the Stochastic RSI reads 0. So even though the RSI barely moved, the Stochastic RSI hit both extremes. Graded against its own range, it can find more overbought or oversold readings to give you than the regular RSI.
The Stochastic RSI plots two lines: a fast one (K) and a smoothed one (D). Crossovers between them are the main signal. Our Stochastic RSI guide shows how those crossovers work.
A quick side note: the Stochastic RSI isn’t the Stochastic Oscillator. The Stochastic Oscillator runs on the price itself, while the Stochastic RSI runs on the RSI. Half the comparison articles online mix them up – now you won’t.
RSI vs Stochastic RSI: head-to-head
| RSI | Stochastic RSI | |
|---|---|---|
| What it measures | The momentum of an investment's price | The momentum of the RSI itself |
| Who built it (and when) | J. Welles Wilder Jr., 1978 | Tushar Chande and Stanley Kroll, 1994 |
| Scale | 0 (sellers fully in charge) to 100 (buyers fully in charge) | 0 (RSI at the bottom of its recent range) to 100 (RSI at the top of its recent range) |
| Standard lookback | The past 14 trading periods (e.g. hours, days, or weeks) | The past 14 trading periods (e.g. hours, days, or weeks) |
| Overbought reading | RSI above 70 – buyers control the trend | Stochastic RSI above 80 – the RSI is near the top of its recent range |
| Oversold reading | RSI below 30 – sellers control the trend | Stochastic RSI below 20 – the RSI is near the bottom of its recent range |
| Sensitivity | Steadier – small momentum shifts stay small | Higher – small momentum shifts get stretched across the full scale |
| Best used for | Judging trend strength and spotting divergences | Spotting momentum turning points early with K/D crossovers |
The pattern behind the table is simple. The RSI reacts to the price. The Stochastic RSI reacts to the RSI – and exaggerates it. That extra step can mean more signals, but also more false alarms.
Real world examples across five markets
The best way to understand the difference between the RSI and Stoch RSI is to see it in action. Here are five real charts – across metals, energy, crypto, and stocks.
Silver: the Stochastic RSI hit more extremes
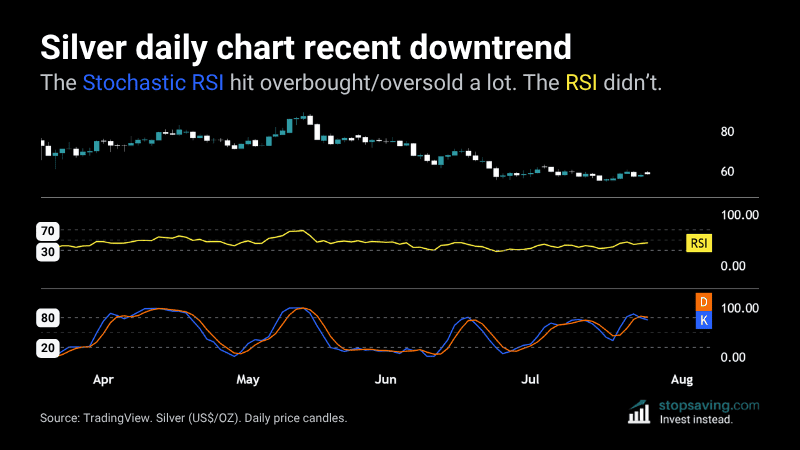
The chart below shows silver’s recent daily price action. The silver price is at the top, with the RSI in the middle and the Stochastic RSI at the bottom. Over this stretch, the RSI mostly drifted between 40 and 70. But the Stochastic RSI took those same moves and stretched them – swinging from overbought to oversold again and again.
Brent crude oil: oversold on one, neutral on the other
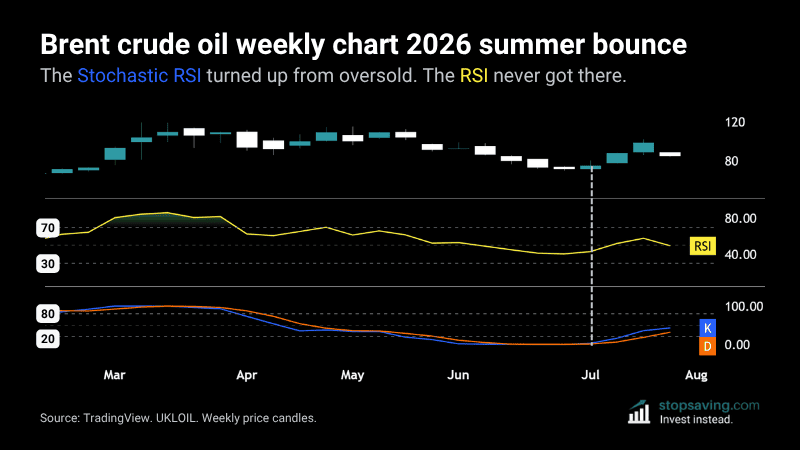
When Brent crude pulled back hard in mid-2026, both indicators dipped together. But the RSI only fell toward 40 – nowhere near oversold. The Stochastic RSI, scored against its own range, went all the way to oversold and turned back up, with the K line crossing above the D line. Then came the bounce. Same dip, two very different readings – and only the Stoch RSI gave you something to act on.
Gold: both flashed the same warning
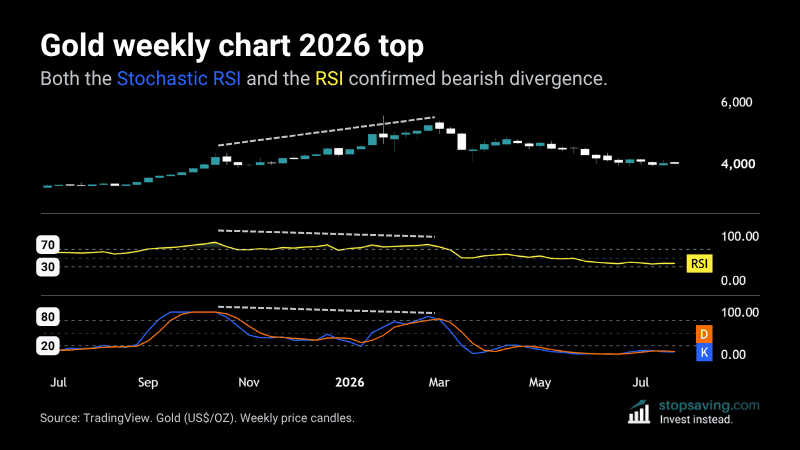
Divergence is when the price moves one way but an indicator moves the other. Into gold’s early 2026 top, the price kept making higher highs. But both the RSI and the Stochastic RSI made lower highs (a bearish divergence on each). Buying pressure was fading even as the price climbed. Gold rolled over soon after.
Bitcoin: the double signal at a bottom
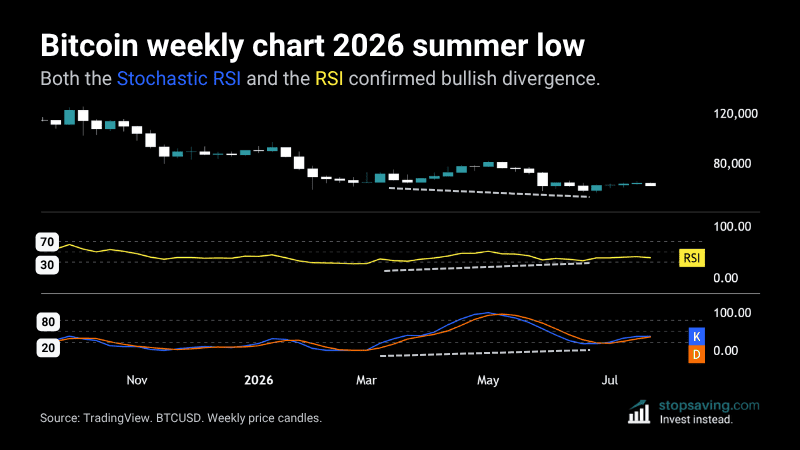
The same signal can work in reverse at lows. At bitcoin’s June 2026 low, the price made lower lows while both indicators made higher lows (bullish divergence). Sellers kept pushing the price down, but with less strength each time. The price turned up from there.
S&P 500: the divergence the Stochastic RSI missed
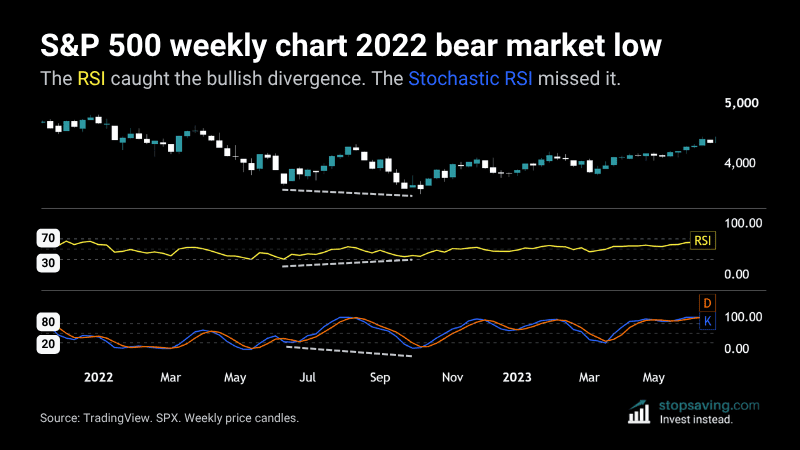
Sensitivity has a cost, though. At its 2022 bear market bottom, the S&P 500 made lower lows while the RSI made higher lows – a clean bullish divergence. The Stochastic RSI showed no such thing. It was swinging across its full range too fast to trace the slow shift underneath. For divergences, trust the steadier RSI line.
Which one should you use?
For long-term investing and swing trading, use the RSI. As the S&P 500 chart showed, the steadier line is the one that catches divergences better – and divergences are the RSI signals worth trading. Our RSI guide breaks down all four types with chart examples.
For short-term trading, use the Stochastic RSI. As Brent crude showed, it can reach overbought and oversold when the RSI gives you nothing. Watch for the K line crossing the D line from above 80, or from below 20. Those crossovers won’t nail exact tops and bottoms – so check the price action before acting on one.
The best answer is both. Use the RSI to judge the health of the trend. Use the Stochastic RSI to time your entry within it. Gold and bitcoin showed what it looks like when the two agree. And when they do, the odds can tilt more in your favor.
To see how they work in reality, add both indicators to a TradingView chart with the default settings. Then watch how differently the two behave for a week. No trades required.
Key takeaways
- The RSI measures the momentum of an investment’s price. The Stochastic RSI measures the momentum of the RSI itself.
- Because it’s scored against its own recent range, the Stochastic RSI (or “Stoch RSI”) tends to reach overbought and oversold more often. So it may have more signals, but also more false alarms.
- An overbought RSI isn’t an automatic sell signal. Strong trends can stay overbought for months.
- Use the RSI for trend strength and divergences. Use the Stochastic RSI to time entries with K/D crossovers.
- The two work best together: the RSI for the trend, the Stochastic RSI for the trigger.
FAQs
Is the Stochastic RSI better than the RSI? No – it’s more sensitive, not better. It tends to reach overbought and oversold more often, which means more signals and more false alarms. The right one depends on how long you hold your trades.
What does “stochastic” mean in trading? It’s a statistics term for anything involving randomness. In trading, it’s come to mean measuring where a value lands within its recent range. The Stochastic Oscillator does this with the price. The Stochastic RSI (or Stoch RSI) does it with the RSI.
Can you use the RSI and Stochastic RSI together? Yes – that’s how many traders get the most from them. The RSI reads the health of the trend. The Stochastic RSI times the entry within it.
What are the best settings for the Stochastic RSI? The default settings work fine for most traders: a 14-period lookback with the standard K and D lines. Changing them adds complexity without adding much edge.
Is the Stochastic RSI the same as the Stochastic Oscillator? No. The Stochastic Oscillator measures the price against its recent range. The Stochastic RSI measures the RSI against its recent range. They’re different indicators.
As usual, none of this is investment advice. To go deeper on either indicator, check out our RSI guide and our Stochastic RSI guide.
About the author

Jonathan Hobbs, CFA
Founder of stopsaving.com
Jonathan Hobbs holds the Chartered Financial Analyst® designation and once managed the investments for a boutique crypto and FX hedge fund. Before that, he worked at firms like Morgan Stanley, HSBC, and M&G Investments. After that, he was lead crypto analyst at Finimize and a capital markets consultant at Chainlink Labs. He currently works with Leverage Shares as a senior analyst, heading up investor education and content on options income and crypto. He founded stopsaving.com in 2017, and wrote four investment books. His articles and market commentary have been featured in the Financial Times, City AM, and Asharq Business Bloomberg.
StopSaving.com is Jon’s independent personal finance education site. Views expressed here are his own and do not represent those of the firms he works with.