Stochastic RSI Explained (How to Use It In Trading)

The Stochastic RSI takes the regular RSI a step further. Instead of looking at price momentum, it looks at the momentum of RSI itself. This guide explains what the Stochastic RSI is, how it works, and how to use it the right way in the markets.
A quick primer on the RSI (relative strength index)
Before we dig into the Stochastic RSI, we first need to understand the original RSI. Put simply, the RSI measures the balance between buying and selling pressure for an investment. When buying pressure is stronger, the RSI goes up. When selling pressure is stronger, the RSI goes down. Simple enough.
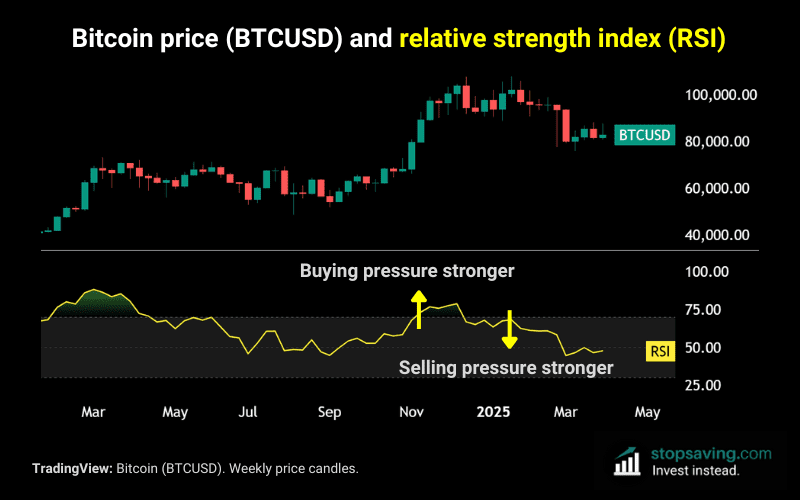
The chart below shows the RSI of bitcoin in yellow (bottom) and the bitcoin price (top). Each red or green candle represents one week of price action. So here, the RSI is gauging bitcoin’s buying and selling pressure over the past 14 weeks.
Here’s what the RSI numbers mean. If the RSI is:
- Above 50: the average gains of “up weeks” are bigger than the average losses of “down weeks”. The closer the RSI is to 100, the stronger the buying pressure (more overbought).
- Below 50: the average gains of “up weeks” are smaller than the average losses of “down weeks”. The closer the RSI is to 0, the stronger the selling pressure (more oversold).
Side note: You can apply the RSI (or any trading indicator) to different time frames like hours, days, or months. For a full understanding of how to use the RSI, download the free PDF guide below.
What is the Stochastic RSI?
Tushar Chande and Stanley Kroll invented the Stochastic RSI and introduced it in their 1994 book, The New Technical Trader.
The Stochastic RSI (Stoch RSI) is a momentum indicator – like the regular RSI. But instead of measuring the price directly (like the RSI), it measures the momentum of the RSI itself. That can make the Stochastic RSI more sensitive and quicker to react than the regular RSI.
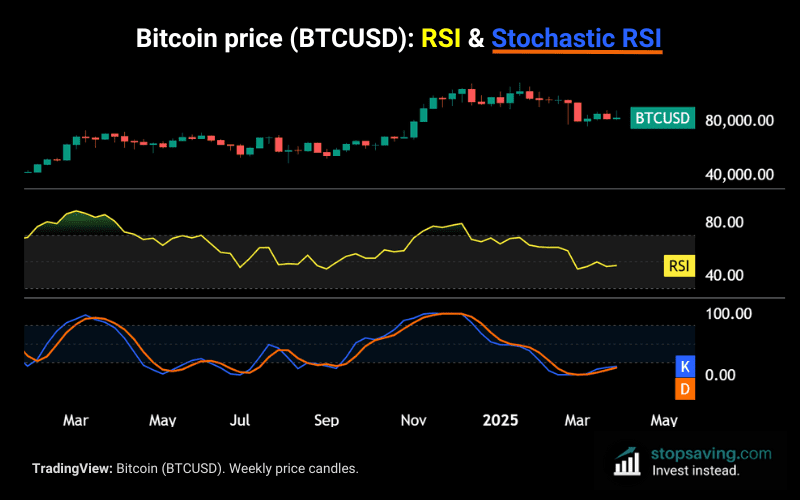
The chart below shows what this looks like (regular RSI at the top, Stoch RSI at the bottom). You’ll notice two lines for the Stochastic RSI. Traders often watch for crossovers between the two:
- The blue line (called K) is the main one. It reacts quickly and shows you when the RSI is heating up or cooling down.
- The orange line (called D) is just a moving average of the blue K line — kind of like a smoother version of it. It helps filter out the noise so you can spot turning points more easily.
How the Stochastic RSI works mathematically
As with most trading indicators, there’s a fair bit of number crunching behind the scenes. While you don’t need to know the math behind the Stoch RSI, it’s useful to understand it.
Here’s the Stochastic RSI formula:
Stoch RSI = (RSI – Lowest RSI) / (Highest RSI – Lowest RSI)
Where:
- RSI = the current RSI value.
- Lowest RSI = the lowest RSI value over a set period (like 14 days).
- Highest RSI = the highest RSI value over that same period.
Like the regular RSI, the Stoch RSI is an “oscillator indicator”. Its value oscillates between 0 and 100.
- If RSI is near its lowest value, Stoch RSI will be close to 0.
- If RSI is near its highest value, Stoch RSI will be close to 100.
How to access the Stochastic RSI indicator in TradingView
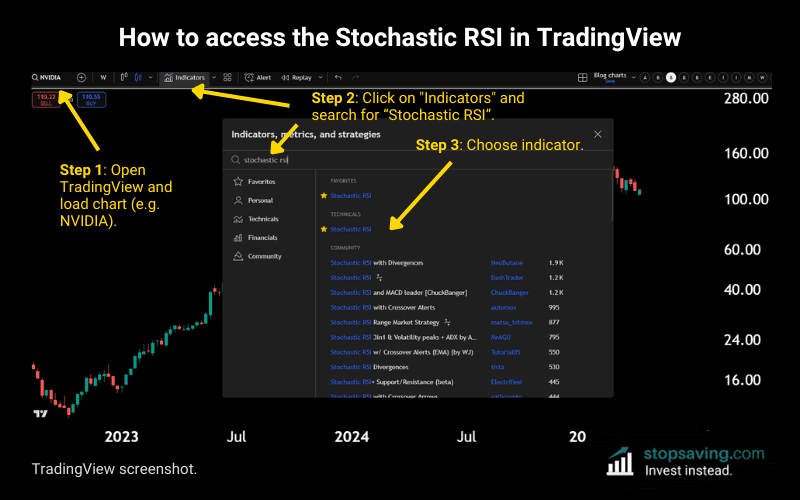
You can use the Stochastic RSI indicator for free on TradingView by following these steps:
- Open TradingView and load any asset chart (bitcoin, Nvidia stock, Nasdaq, etc.).
- Click on “Indicators” and search for “Stochastic RSI”.
- Click to add the Stochastic RSI indicator to your TradingView chart
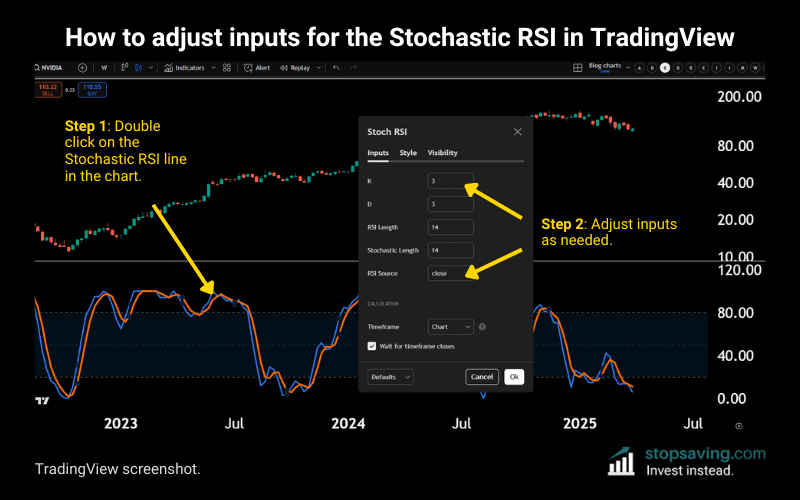
Once added, you can change the indicator settings depending on your strategy (e.g. K line, D line, RSI length). But don’t overcomplicate it: you’re probably best off sticking with the default settings as they are.
For a full breakdown of how to use TradingView, download our free PDF guide below:
How to use the Stochastic RSI in your trading strategy
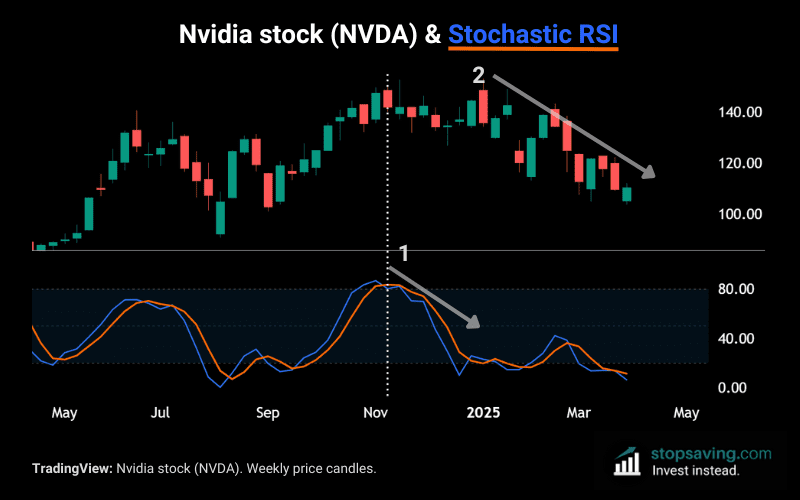
The best way to learn how to use the Stoch RSI is to see in action with a real example. The chart below shows Nvidia stock (NVIDIA) from late 2024 through early 2025. I’ve used weekly price candles here to focus on the longer term trend.
In November 2024, the blue Stoch RSI line (K) crossed below the orange moving average line (D). This was also from a relatively high reading (around 80) – meaning upward momentum was strong before the cross. The cross never called the exact Nvidia top (that only happened in January) – so it wasn’t a clear sell signal. But it was an early warning sign that buying pressure was fading.
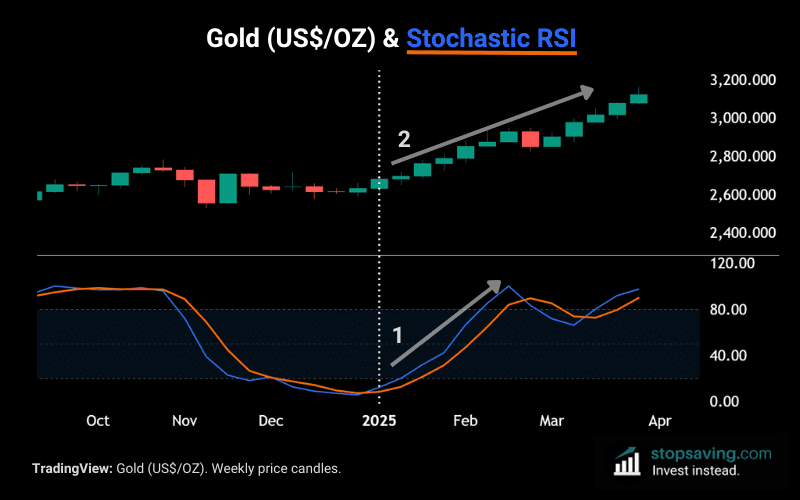
Gold’s big rally started the opposite way. The blue K line crossed above the orange D line – from a much lower base (around 15). The cross wasn’t a “buy signal” on its own – but a good indication that selling pressure was easing. In this case, it was an extra confirmation to “trust the gold bounce”.
Bottom line: Use the Stochastic RSI to spot momentum turning points early – not to time exact tops or bottoms. A crossover from a high or low reading won’t guarantee a reversal. But it can give you a heads-up that buying or selling pressure is shifting. Just make sure to combine it with other analysis – it’s helpful, but not the be-all and end-all.
Key takeaways
- The Stochastic RSI measures the momentum of the RSI – not the price. That can make it more sensitive to momentum shifts than the regular RSI.
- It can help you spot market turning points early – but it won’t time exact tops or bottoms.
- Use it with other tools (like price action or trendlines) to filter out noise and avoid false signals.
As usual, none of this is investment advice. If you liked this piece, check out my free newsletter for how-to guides and investment insights across crypto, stocks, metals, and more.