

US 10-Year Treasury Yield (Head & Shoulders Breakdown)
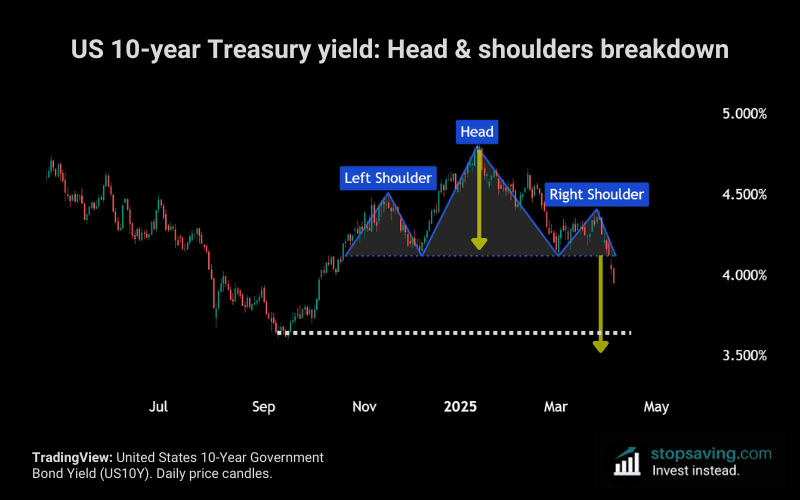
The US 10-year Treasury yield just dipped below 4% for the first time in months. This was after breaking down from a textbook head and shoulders pattern (blue, in the chart). And it could be a big deal for bonds, stocks, and the economy.
Why the 10-year yield drop matters
The 10-year Treasury yield is basically the world’s most important interest rate. It’s the interest rate the US government pays to borrow for a decade. That influences everything from mortgage rates to tech stock valuations.
When the 10-year Treasury yield drops, it means investors are buying more 10-year Treasury bonds. That bids up bond prices, so the yield (bond interest payments as a percentage of the price) goes down. And because the 10-year yield is so important, it tends to drag other interest rates down with it.
Lower interest rates usually mean cheaper borrowing costs for people and businesses – but that’s not always a good thing. Investors might buy Treasuries when they’re worried about the economy, stocks, and market risk in general. So when the 10-year yield drops fast, it could mean the market smells trouble ahead.
Keep in mind that central banks also buy Treasury bonds – especially when they think the economy is slowing. By buying bonds, they lower interest rates, which can free up liquidity to jumpstart the economy. It also means central banks (and investors) might be less concerned about inflation – and more concerned about an economic slowdown.
What the head and shoulders pattern means
Head and shoulders patterns don’t always play out. But if this one does play out, the technical target for the 10-year yield would be somewhere near 3.5%. That would put it below its September 2024 low of 3.6%.
The next chart zooms out to gauge the bigger picture for the 10-year yield. The green line connects month-end yields to cut out short-term noise. That’s forming a descending triangle pattern – with lower highs (since peaking at 5.021% in October 2023) and similar lows. If the short-term head and shoulders pattern plays out, the long-term descending triangle would also be in break down territory. And the technical target for that is much lower – somewhere just below 3%.
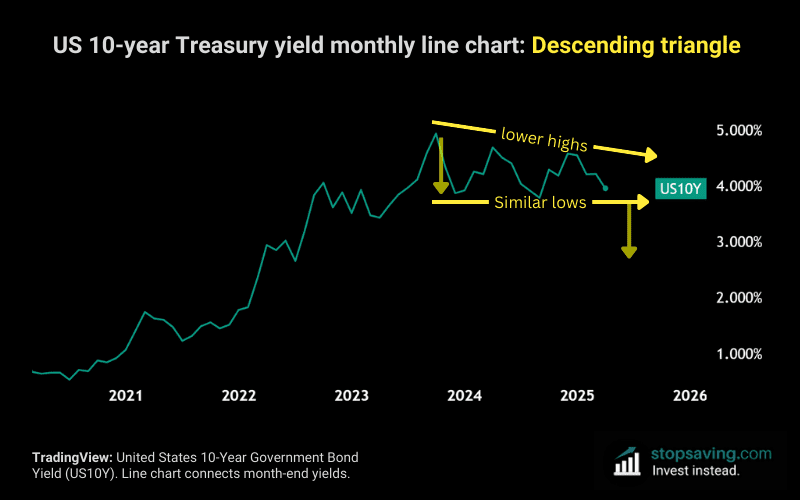
Chart speculation aside, Treasury bonds look cheap right now. Read this article I wrote about buying US Treasuries in October 2023.
As always, this isn’t investment advice. If you want to learn the dark arts of chart speculation, grab our free PDF guide below:


