QQQ is Near its Long-Term Trendline (Again)
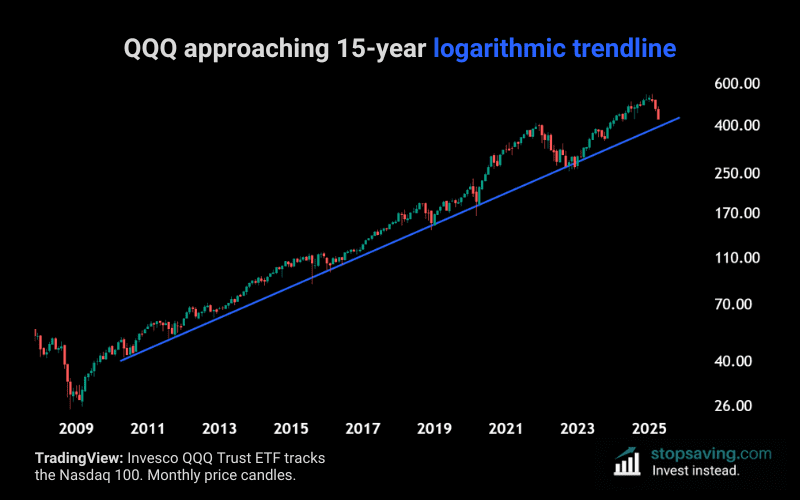
The Invesco QQQ ETF (QQQ) tracks the Nasdaq 100 – the go-to index for big tech growth stocks. Since 2010, the upward trendline in blue has supported QQQ’s price – and it’s now getting close to it again. As the chart suggests, buying the QQQ exchange-traded fund near the trendline worked out well in the past.
QQQ’s logarithmic trendline explained
The chart tracks the price of QQQ, with each red or green candle being one month of price movement. I’ve set the chart to “logarithmic scale” in TradingView, which means the chart focuses on percentage moves. That’s why the numbers on the Y-axis don’t go up in equal amounts.
When analyzing long-term trendlines (like this one), using logarithmic scale gives you a clearer picture. For example, it treats a 100% move from $50 to $100 like a 100% move from $100 to $200. This helps you guage percentage moves better over time – which is what really matters in long-term charts.
At some point, QQQ’s long-term trendline will probably break – with the price dipping far below it. But until that actually happens, buying near the trendline could offer good reward potential for risk.
The risk is that the trendline breaks. So buying QQQ closer to it means the trade “failure point” would result in a relatively smaller loss.
As usual, none of this is investment advice. For a full understanding of how to trade using trendlines, download our PDF below: