

In this guide, I’ll explain how to use simple trendlines to improve your trading or investment strategy. You’ll learn how to draw trendlines in your charts—and how to use them to decide when to buy or sell an investment. So without further ado, let’s jump in.
Video version of this guide
PDF download for this trendline trading guide
You can also download the PDF slide deck version of this guide below. This can be used to summarize the main concepts of the guide.
Trendlines explained: what are trendlines?
As the name suggests, trendlines are lines on a price chart that plot the trend of an investment (up or down).
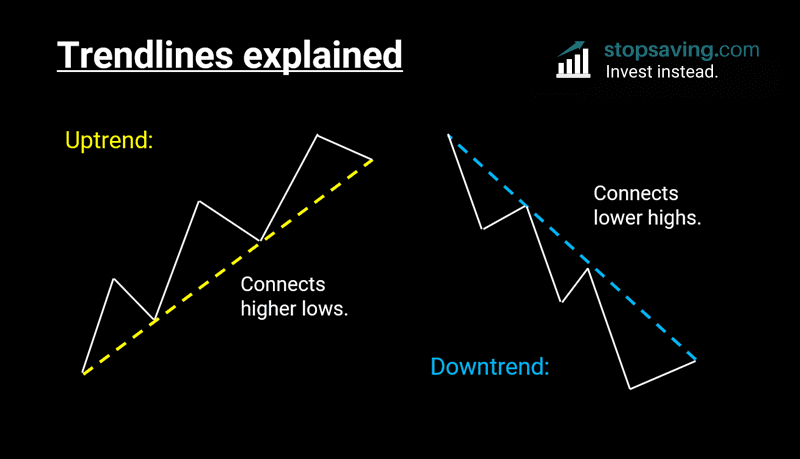
An upward trendline shows the price trending higher—it connects two or more higher lows of the price. A downward trendline shows the price trending lower—it connects two or more lower highs of the price. The diagram below explains this concept visually.
How to draw trendlines on a price chart
Trendlines don’t need to be exact—you’re just trying to find the “line of best fit” when you draw them. The basic idea is to connect two or more touchpoints in the chart. Those touchpoints can be candlestick wicks, closures (learn more about candlestick charts here), or a combination. Of course, the more touchpoints you have, the stronger the trendline for traders.
Trendline example: Nasdaq 100 index
The chart below shows the Nasdaq 100 index (ticker NDQ on TradingView), with each red or green candle representing one week of price movement. We’re using a logarithmic (log) chart here. Log charts are generally better for longer-term time frames. That’s because they reflect the percentage changes in the price rather than the dollar or point amount. So now, I’ve drawn an upward-sloping logarithmic trendline in yellow—it connects a series of higher lows for the Nasdaq dating back to 2011.
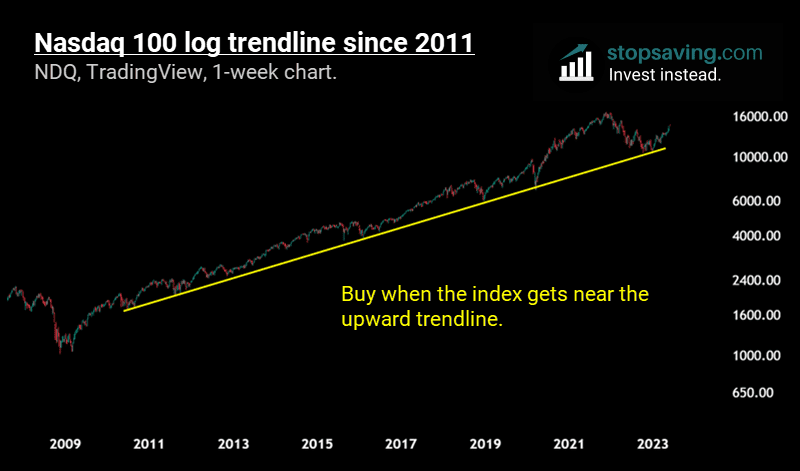
It’s remarkable how this trendline has held up for so long. If you’d bought the Nasdaq whenever it got close to the trendline in the past, you’d have done pretty well for yourself. Buying near the bottom of an upward-sloping trendline can also give you good reward potential for your level of risk. If the trendline breaks after you buy in, you can sell your position for a relatively small loss.

How to trade any investment using trendlines
You can draw trendlines for any investment; bitcoin below is no exception. Again, I’m using a log scale chart to focus on percentage changes in the price over time.
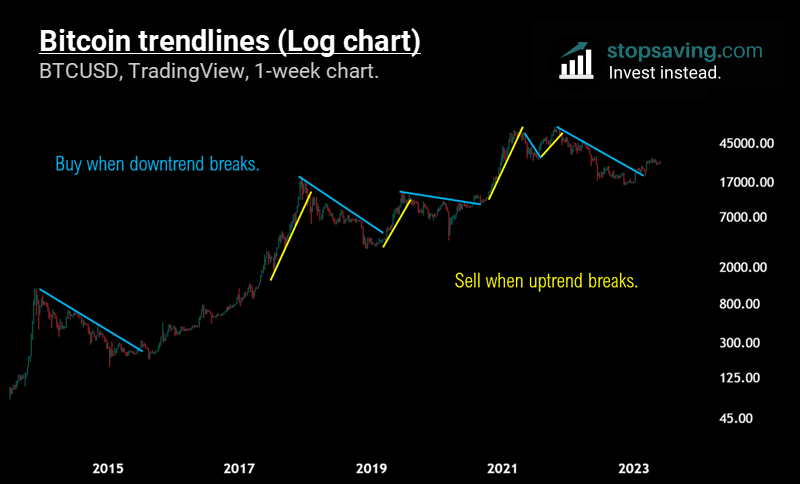
Here’s a simple long-term trendline strategy that would’ve worked wonders for bitcoin investors over the years:
- Buy when the downtrend breaks.
- Sell when the uptrend breaks.
Note that you’ll want to see an actual candle closure below or above a trendline for it to break. That way, you can be more confident the trend has broken. Learn more about candlestick charts here.
Another way to trade trendlines is to buy or sell on a trendline retest. Notice the blue downward trendline for the US Dollar index (DXY) in the chart below, which broke to the upside in early 2021. But the price didn’t blast higher straight away. It first went back down to retest the trendline from the other side. At that point, a savvy trader might have bought the DXY near the trendline retest.

As shown in yellow above, you can apply the same rationale to selling. Notice how the index quickly wicked higher to retest each upward trendline after breaking it. These would’ve been great times to short the index from a risk versus reward perspective. Because if the price happened to close the week back above the trendline (instead of getting rejected by it), you’d have known to get out of your short position.
Keep in mind that trendlines won’t always get retested perfectly. But if they do, it can be a good trading opportunity. Regardless, trading the US dollar index based on simple trendlines is easier (and likely more profitable) than trying to predict the path of American interest rates and inflation.
Enjoyed this guide? Sign up for our free newsletter for how-to-guides and investment ideas across crypto, stocks, metals, and more.
This guide is part of our 100% free trading and technical analysis course. The next guide in the series is on how to use price support and resistance in your strategy.
Key takeaways
- Trendlines can be helpful tools to show the momentum of an investment—and when that momentum breaks.
- When you draw a trendline, connect a line between at least two points on a price chart. For longer-term trendlines, use log charts.
- An upward trendline connects higher lows. A downward trendline connects lower highs.
- Wait for candle closures above or below a trendline to confirm a break. Buying or selling after a trendline retest is even better if you get one.