

STRC Stock Reclaims the 50% Fibonacci After Crashing
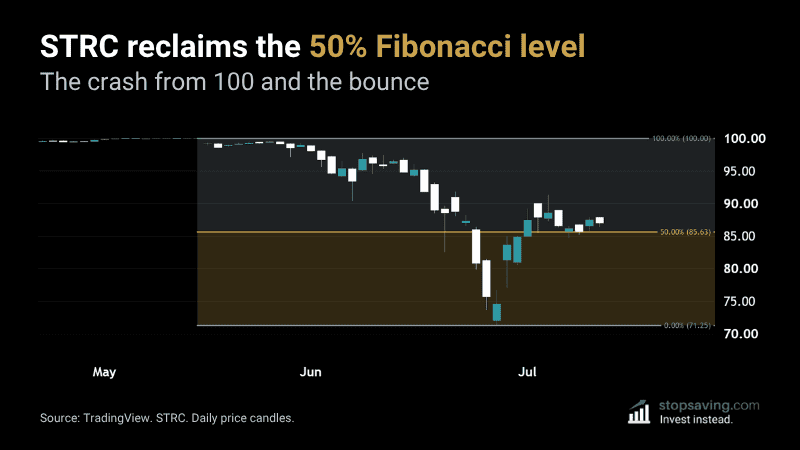
When a price recovers half of a big crash, traders take note. That halfway point is the 50% Fibonacci level – and Strategy’s STRC preferred stock has now reclaimed it. Here’s what this thing is, why it crashed, and what to watch now.
What is STRC?
STRC (“Stretch”) is a preferred stock from Strategy – the company that holds more bitcoin than any other company. A preferred stock is a share that gets first claim on any dividends the company pays (hence “preferred”). Strategy sells STRC to investors and uses the cash to buy more bitcoin. In return, holders collect a cash dividend twice per month.
That dividend rate works like a dial. Strategy sets the rate as a percentage of $100 – the price STRC is designed to hover near. If the price drops below $100, Strategy can dial up that rate to tempt buyers back. And it has: the dividend rate started at 9% in July 2025 and now pays 12% – or $12 a year per share.
The recent STRC crash also increases your dividend yield compared to someone who bought at $100. That’s because the $12 yearly dividend stays fixed no matter what you paid. So if you bought STRC at today’s price of about $87, your personal yield would be around 13.8% ($12 divided by $87, not $100). Not investment advice.
But there’s no free lunch with that dividend. Unlike normal shares, the STRC stock price is effectively capped at $100. If it climbs higher, Strategy can lower the dividend rate – and buyers lose interest until the price drops back. And even though there’s limited upside, the price can still crash (like we saw in June).
Why did STRC crash in June?
Because the calm invited risky borrowing. STRC traded between $99 and $100 for months. So some investors borrowed money to buy more of it – the dividend paid them more than the interest on the loan.
Here’s the flaw in that trade: the STRC shares themselves were the security for those loans. When bitcoin dropped below $60,000 in early June, nervous holders started selling, and STRC slipped below $100. Falling shares meant weaker security – so brokers demanded cash upfront to cover the difference. That’s a margin call. And the dividend couldn’t help: it drips in at $12 a year, while the stock price was in freefall.
Those “borrowed-money” buyers had to sell shares to raise cash, which pushed the price lower – and triggered more margin calls. This “liquidation cascade” dragged STRC down to a low of $71.25 by June 26.
Strategy responded like its life depended on it. On June 29 – days after the low – it raised the dividend rate from 11.5% to 12%. It also sold about $1.15 billion of new MSTR shares to top up a cash pot to $2.55 billion. By board rule, that pot is just for dividends (for STRC and its other preferred shares) and interest on its debts. Strategy can even sell up to $1.25 billion of its bitcoin to refill the pot. All in, that’s about 26 months of payments covered.
The 50% Fibonacci is the level to watch
STRC fell $28.75, from $100.00 to $71.25. If you add half of that back to the low you get $85.63 – the 50% Fibonacci level. The price is now trading just above it.
Now, an instrument like this doesn’t usually trade on technicals – the dividend dial does most of the steering. Still, big traders who bought the panic are probably watching the same level. Daily closes above $85.63 keep the recovery on track toward $100. A close back below it puts downside risk back on the table.
Strategy built STRC to be boring. The chart says it’s halfway back to boring.
As usual, none of this is investment advice. To learn more about Fibonacci retracement levels, check out our free Fibonacci trading guide.



