


Fibonacci trading is based on an ancient number sequence discovered thousands of years ago. In this guide, you’ll learn how to use Fibonacci retracements and extensions in your strategy—powerful tools for identifying key price levels in charts. We’ll explore how you can apply the ancient wisdom of Fibonacci levels to modern markets. For a comprehensive walkthrough, you can also watch the video version of this guide below.
Fibonacci trading video guide
Check out the video below, where I’ve explained Fibonacci trading in more detail.
This guide is part of our 100% free trading and technical analysis course.
Fibonacci trading guide PDF Download
You can also download the condensed PDF version of this guide below. Use it as a cheat sheet for the more detailed written and video versions.
Fibonacci history lesson
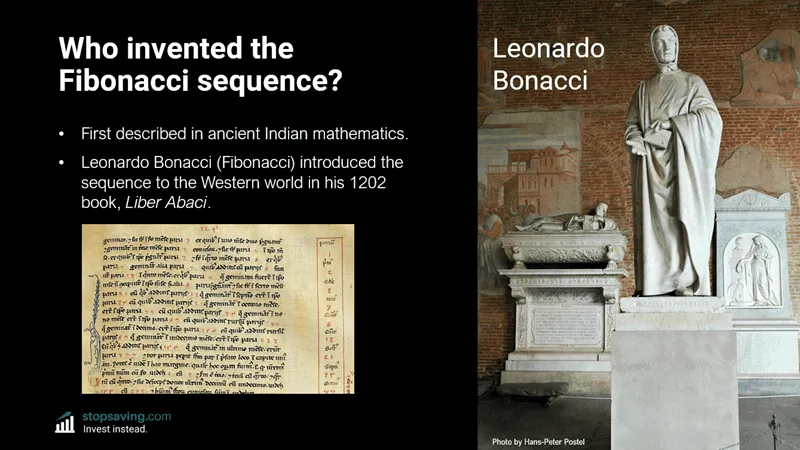
Ancient Indian mathematicians first developed the concept of Fibonacci numbers. Over 1,000 years later, Italian mathematician Leonardo Bonacci (later known as Fibonacci) formalized the Fibonacci sequence in 1202 with his book Liber Abaci. The photo below by Hans-Peter Postel shows a statue of Fibonacci in the Camposanto Di Pisa. On the left, you’ll also see an excerpt from Liber Abaci (if you happen to speak old-school Latin).
With that ancient history lesson out the way, you’re probably wondering what all the fuss is about these numbers. Here’s how the Fibonacci sequence works. If you start with zero and add a 1, you get 1. Then, if you add a 1 to that number, you get 2. Simple enough.
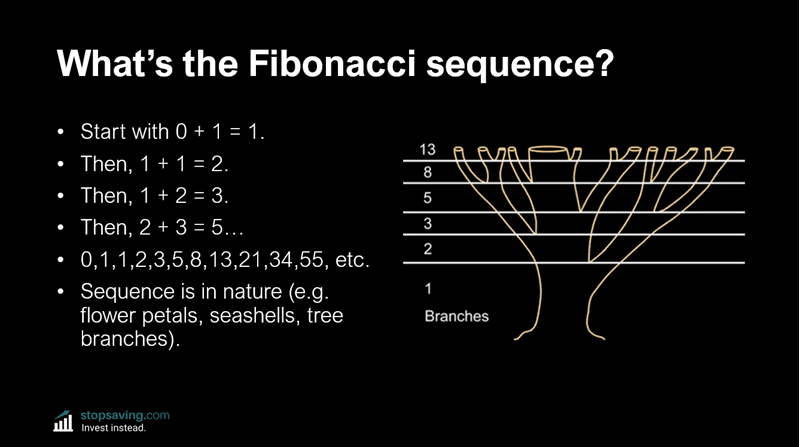
Now, add your first answer (1) to your second answer (2) to get 3. Then, add 3 to the answer before it (2) to get 5. This goes on until you get the Fibonacci sequence, which looks like this:
0, 1, 1, 2, 3, 5, 8, 13, 21, 34, 55, 89, 144…
The Fibonacci sequence appears all over nature. You can find it in flower petals, seashells, and tree branches (see the image below).
How to calculate the “golden” Fibonacci ratio
Using the Fibonacci sequence, you can calculate the golden Fibonacci ratio. If you divide a number in the Fibonacci sequence by the number after it, you’ll get a value approaching 0.618–the golden Fibonacci retracement. For example, if you divide 8 by 13, you get 0.615. Now, if you divide 34 by 55, you get 0.618 (rounded to three decimal places). So, the further down the sequence you go, the closer you get to 0.618.

To get the 1.618 golden Fibonacci extension, you can do the opposite: divide a number in the sequence by the number before it. For example, dividing 55 by 34 gives you 1.618 (rounded to three decimal places).
What is Fibonacci trading?
Traders use Fibonacci levels to plot key support and resistance areas in their price charts. Depending on their strategy, they’ll use Fibonacci retracements and/or Fibonacci extensions.
Using the golden Fibonacci retracement level in trading
A Fibonacci retracement is when a price move (up or down) retraces (pulls back) by a certain percentage in the opposite direction of the trend. Let’s use the below bitcoin chart as an example. I’m using a logarithmic price chart here because they tend to work better over longer trading time frames—they focus on percentage gains rather than price gains.
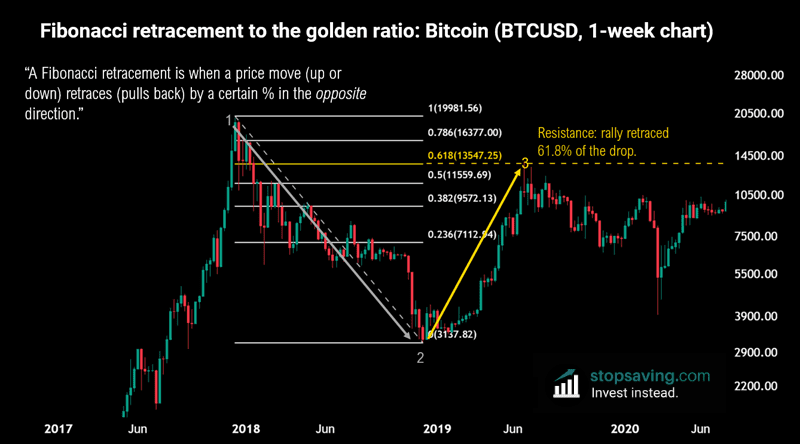
After bitcoin’s top at around $20,000 in December 2017 (point 1), it dropped to about $3,000 (point 2) over the next year or so. It then staged a massive rally to almost $14,000 (point 3). This was also the 0.618 Fibonacci retracement level of the initial leg down from point 1 to point 2. Put another way, the rally from point 2 to point 3 was a 61.8% retracement of the initial drop from point 1 to point 2.
Given the accuracy of this measure, it makes you wonder: is it a self-fulfilling prophecy or a natural phenomenon? I’d say it’s a bit of both. Many big traders watch Fibonacci levels so that’s where they take profits. And at the same time, the markets are a mathematical expression of human emotion—another part of nature.
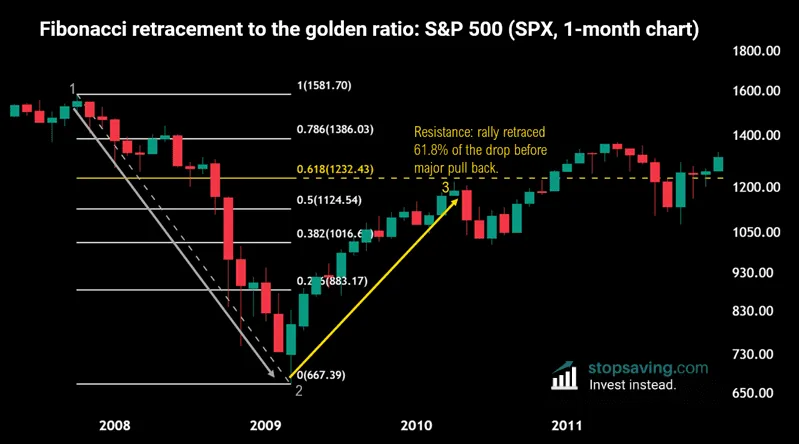
It’s not just crypto where you might find Fibonacci ratios working their magic. Here’s a chart of the S&P 500 index crashing during the 2008-09 Global Financial Crisis—before rallying to 0.618 Fibonacci retracement level afterward. The index went much higher in the following years, but it wouldn’t have hurt to take a bit of profit near the 0.618 Fib level.

Other Fibonacci retracement levels (0.232, 0.382, 0.5 and 0.786)
So far, we’ve learned about the 0.618 golden Fibonacci retracement level used in trading. But there are several others you should be aware of.
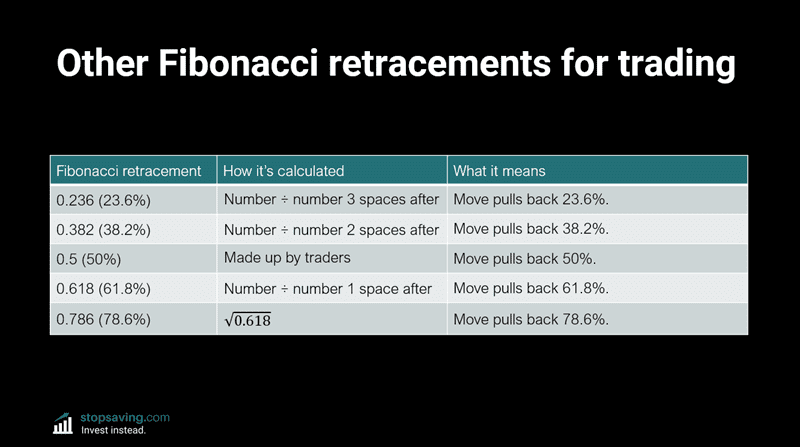
The 0.236 Fibonacci retracement is calculated by dividing a number in the sequence by the number three spaces after it, and it represents a 23.6% pullback of a price move. The 0.382 Fibonacci retracement divides a Fibonacci number by the number two spaces after it. And that’s when a move pulls back 38.2%.
The 0.5 Fibonacci retracement actually has nothing to do with the Fibonacci sequence—it’s completely made up by traders. Still, it’s when the price retraces 50% of the move. And finally, there’s the 0.786 retracement level. That’s the square root of 0.618, representing a 78.6% pullback in the price.
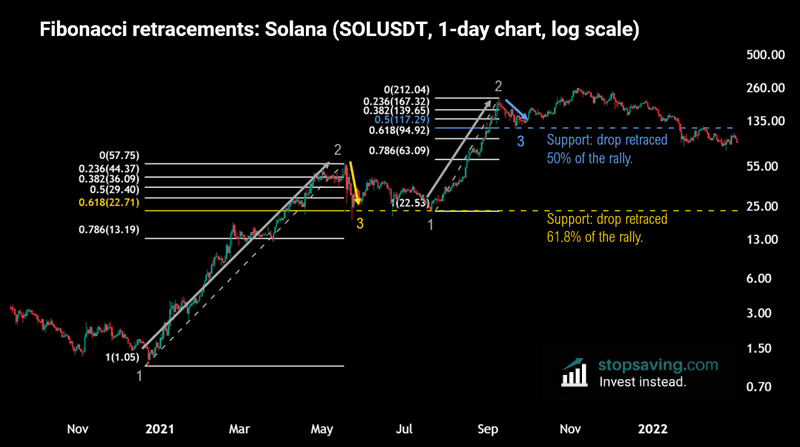
Here’s an example of Solana retracing to the 0.5 Fibonacci in blue…
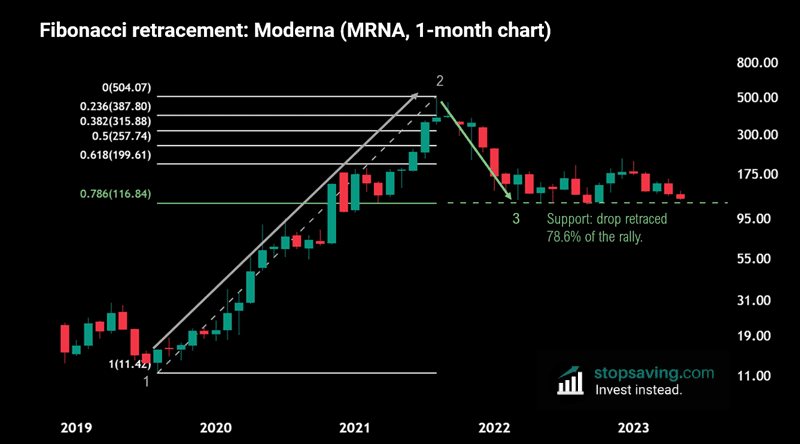
And here’s one of Moderna’s stock price retracing to the 0.786 Fibonacci level in green…
What are Fibonacci extensions?
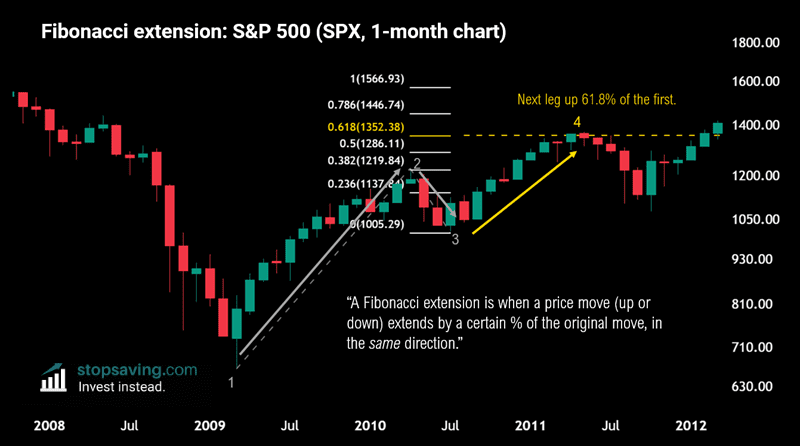
A Fibonacci extension is when a price move (up or down) extends by a certain percentage of the original move, in the same direction of that initial move. Here’s an example with the S&P 500 index. The index rallied from point 1 (in 2009) to point 2 without any major pullbacks. It then pulled back to point 3 to make a higher low. From point 3, it rallied to point 4—the 0.618 Fibonacci extension level. In other words, the move from point 3 to point 4 was 61.8% the size of the initial move from point 1 to point 2.
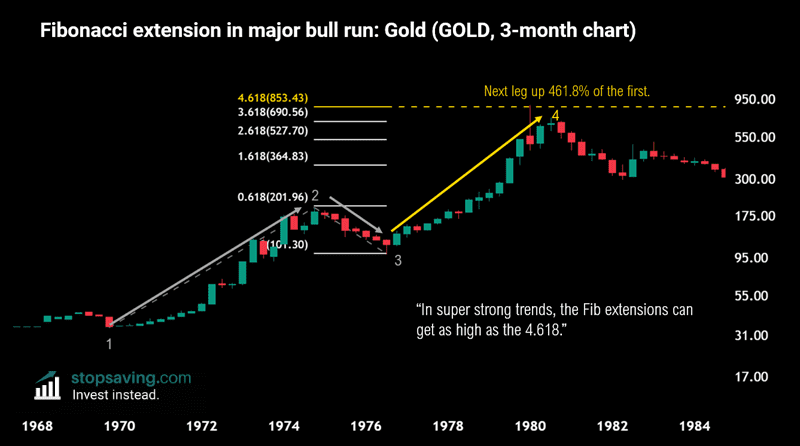
In major bull runs, the price can extend to much higher Fibonacci levels than the 0.618 extension. In fact, Fibonacci extensions can get as high as the 4.618 level in super strong trends. That’s what we see with gold in the 1970s and 1980s in the chart below. Not a bad time to be in gold!
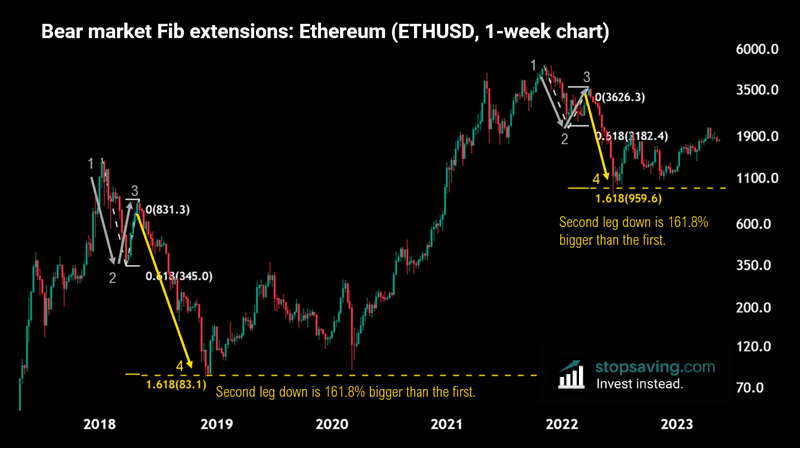
You can also have bearish Fibonacci extensions. Here’s a chart of Ethereum bottoming out at the 1.618 extension in two different bear markets, one after the other.
Like this content? Sign up for our free newsletter for how-to-guides and investment ideas across crypto, stocks, metals, and more!
Key takeaways
- Leonardo Bonacci (a.k.a Fibonacci) formalized the Fibonacci sequence in his 1202 Book, Liber Abaci. But it was first discovered by ancient Indian mathematicians much earlier.
- Fibonacci numbers mysteriously appear all over nature – and in price charts, too.
- A Fibonacci retracement is when a price move (up or down) retraces (or pulls back) by a certain percentage in the opposite direction of the initial price move.
- A Fibonacci extension is when a price move (up or down) extends by a certain percentage in the same direction as the initial price move.
- You can use Fibonacci retracements and extensions as potential price support or resistance areas in your trading strategy.