

Solana Double Bottom With Bollinger Bands
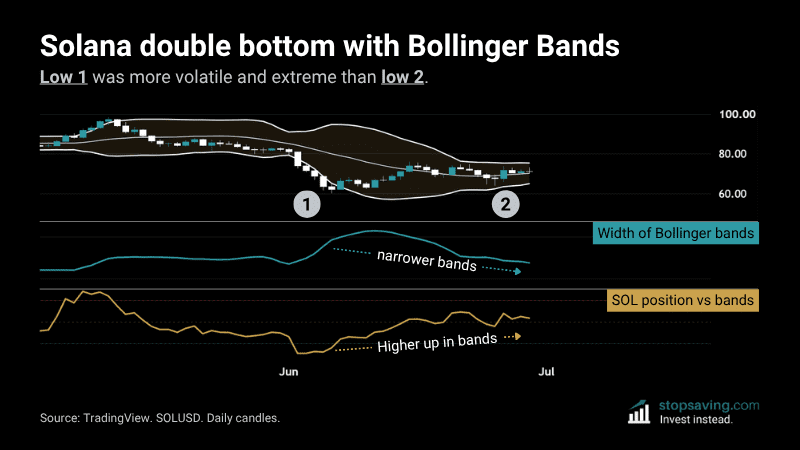
Solana (SOL) has made a double bottom pattern, with two major lows in June. The first low was on June 6 at $60.12 per SOL (SOLUSD, TradingView). The second low came on June 25 at $63.97 – higher than the first. Throw some Bollinger Band analysis around these two lows, and there could be more upside for SOL.
Here’s how the trade setup works – and how to know if it doesn’t.
The chart explained: Solana’s double bottom with Bollinger Bands
This chart shows the daily price candles of Solana at the top, with each candle representing one day of price action.
The Bollinger Bands (in white) measure Solana’s volatility around its 20-day moving average (also the middle band). The wider those bands, the more volatile Solana’s price gets around that moving average. The narrower they get, the less volatile the price – and the closer it gets to that 20-day average.
The teal line underneath measures the width of the Bollinger Bands. And the gold line at the bottom tracks Solana’s price relative to the bands.
Now, look at each low with Bollinger Band analysis:
- Low 1: This was below the lower Bollinger Band, and the bands were wider. In other words, it was a “more extreme, more volatile low”. Lots of panic selling and brave dip buying.
- Low 2: This was above the lower band, and the bands were closer together. This was a “less extreme, less volatile low”. Less panic selling and more gradual dip buying.
Looking at the above pattern, the Solana sellers are getting weaker. And the buyers are getting stronger.
That would suggest more upside for Solana. And if the bands get wider with that upside, it could turn out to be a good trade.
When the Solana setup fails
In my books, the idea would “fail” only if Solana closed a daily candle below the middle band.
Until then, the 20-day moving average seems to be holding as support.
As usual, none of this is investment advice. To learn more about Bollinger Bands, check out our Bollinger Bands guide.



