


When choosing indicators for your trading or investment strategy, it’s all about quality over quantity. Enter Bollinger Bands—the ultimate “all-in-one” indicator. In this guide, I’ll explain Bollinger Bands and why they can add value to any trading or investment strategy. I’ll also show you how Bollinger Bands are calculated, so you can understand the logic behind the indicator and why it works in trading.
Bollinger Bands video guide
Check out the video version of this guide below, where I explain Bollinger Bands and how to use them in trading and investing.
PDF download for this Bollinger Bands guide
You can also download the PDF slide deck version of this guide below. This can be used to summarize the main concepts of the guide.
Why volatility is essential in trading
Before diving into Bollinger Bands, it’s important to understand investment volatility and how it works. Volatility is how much an investment’s price moves (up or down) in a given time. The more the price moves, the more volatile the investment.
Asset prices shift between low, normal, and high volatility periods. Low volatility usually precedes high volatility—and vice versa. When volatility is low, a small catalyst can move the price by a lot. After periods of high volatility, volatility tends to decrease as investors lose interest in the investment.
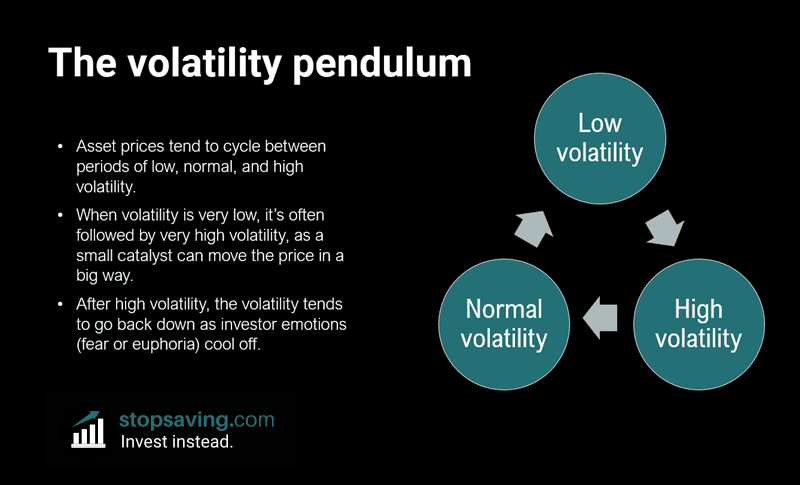
It’s hard to predict the price direction when volatility rises. Still, knowing that prices are likely to get volatile is valuable information for traders. More on that later.
Who invented Bollinger Bands?
If there’s one man who understands the importance of volatility in trading, it’s John Bollinger, who invented Bollinger Bands in 1983 as the Financial News Network (FNN) chief market analyst. He also wrote a brilliant book on Bollinger Bands, which is well worth your time. In the book, Bollinger explains that he only named the indicator when a news presenter asked about it in a live interview. The first response he could think of was “Bollinger Bands.”
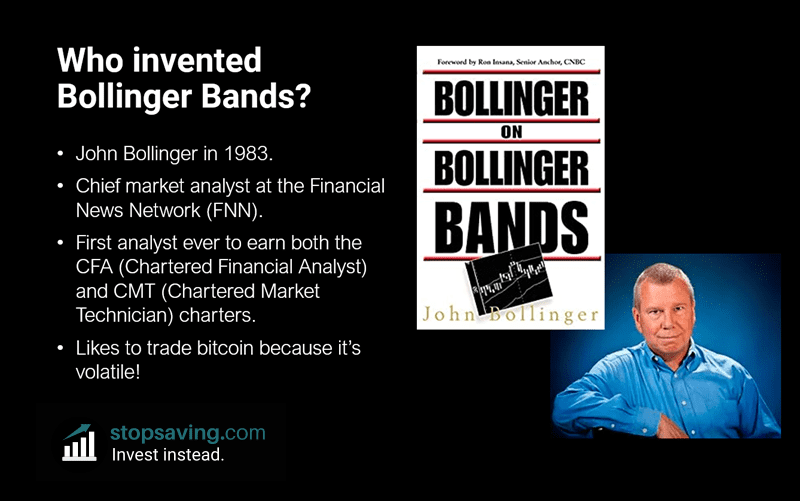
Interesting side note: John Bollinger was the first analyst in history to hold the CFA (Chartered Financial Analyst) and CMT (Chartered Market Technician) designations simultaneously. As a CFA charterholder myself, I can tell you that the exams aren’t easy. If you follow Bollinger on Twitter, you’ll also know he likes to trade bitcoin because it’s volatile!
What are Bollinger Bands?
Bollinger Bands are an “all-in-one” trading indicator because they can tell you a few things about an investment:
- How volatile it is at any point.
- If its volatility is increasing or decreasing.
- If the trend is getting stronger or weaker.
- When the investment is overbought or oversold.
- Whether there’s “extreme” price movement for the investment.
The chart below shows three bands: a middle band, an upper band, and a lower band. In this example, we’re using the bitcoin daily candlestick chart, so each red or green candle represents one day of price movement.
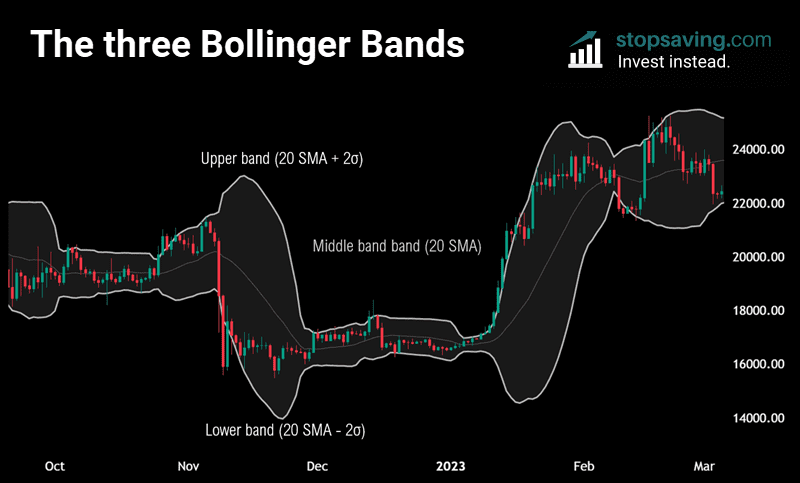
The middle band is the 20-day simple moving average (SMA). For this example, the trading period is a day–but it could be any trading time frame from minutes to months. The 20-day simple moving average updates each day to show the average price of the investment over the past 20 days. It represents the general trend of the investment.
Then there are the upper and lower bands. These get wider (further from the middle band) when volatility rises, and narrower (closer to the middle band) when volatility drops.
Bollinger Bands math: How it works
The upper band is the 20 SMA plus two standard deviations of price movement, and the lower band is the 20 SMA minus two standard deviations of price movement. Standard deviation (or “sigma”) is just a fancy word for volatility—it measures how spread-out numbers are in a data set. The standard deviation tells us if values are close to the average (low standard deviation) or spread out over a wide range (high standard deviation).
For example, a group of people can have a low standard deviation of height variations (5’6’’ to 6’’) or a high one (4’10 to 6’8’’). It’s the same with percentage price moves for an investment. Low standard deviation means low volatility (prices stay closer to the 20-day SMA). High standard deviation means high volatility (prices are further from the 20-day SMA).
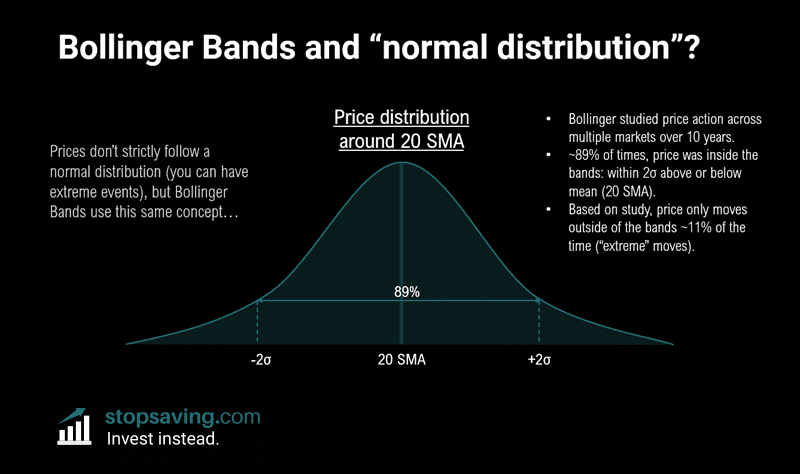
If you’ve studied statistics at school or university, you’re probably familiar with a normal distribution. Visually, it looks like a bell curve, which you can see below. According to the laws of statistics, if you take a big enough group of people’s heights; you’ll get a normal distribution. The average height would be in the middle of the bell curve. Roughly 68% of the people would have a height within one standard deviation of that average—taller or shorter. And around 95% would have a height within two standard deviations of the average. In other words, 5% would have a height not within two standard deviations of the average height.

What do normal distributions and bell curves have to do with Bollinger Bands?
Bollinger studied prices across multiple investments over ten years. He found that prices don’t strictly follow a normal distribution because extreme events occasionally cause them to move in extreme ways. Instead, he found that prices “almost” follow a normal distribution. His research showed that about 89% of the time, the price was inside the Bollinger Bands—i.e., within two standard deviations above or below the middle band. Based on that study, prices only have “extreme” moves (outside the bands) about 11% of the time. That’s usual information for any trader.
Bollinger Bands example: Bitcoin
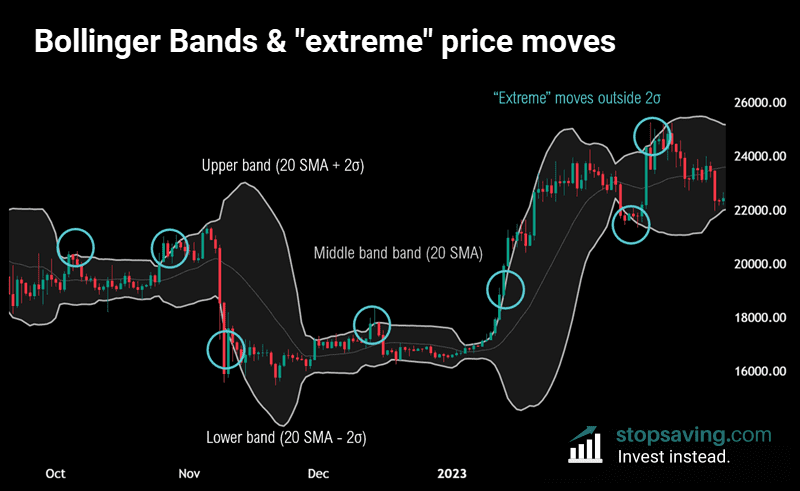
Let’s now apply Bollinger Band theory to an actual price chart: the bitcoin one-day candle chart below. The middle band is the 20-day SMA, which shows the general trend. Then there’s the upper band, representing two standard deviations of price movement above the middle band. Finally, there’s the lower band, which is the 20-day SMA minus two standard deviations of price movement. Recall that “extreme price moves” outside the bands occur about 11% of the time on average. I’ve circled a few examples of when this happened with bitcoin in the chart.
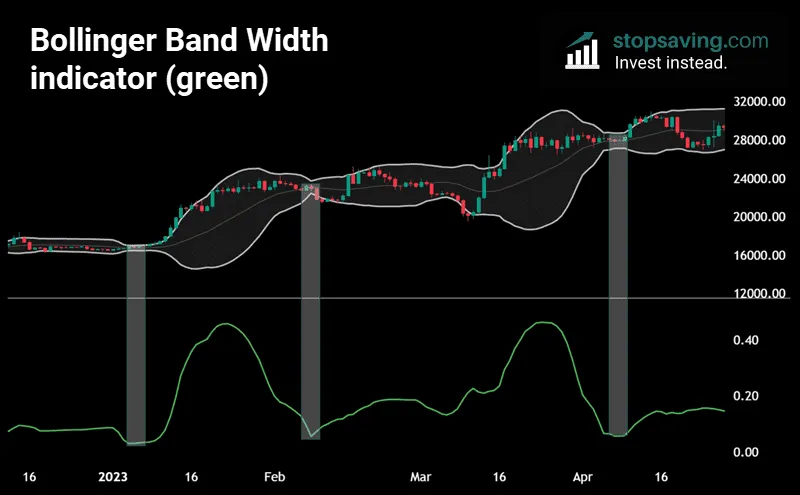
Remember that Bollinger Bands are a volatility indicator, and investments tend to shift from low to high volatility. That’s why traders pay close attention when there’s a Bollinger band squeeze and the bands pinch closer together. It’s a sign volatility is very low—a warning that a big volatile price move could be just around the corner. Notice the Bollinger Band squeezes circled in the chart below. Each squeeze led to explsosive volatility after.

Bollinger Band Width indicator
For the most part, you can “eyeball” a price chart to gauge the width of its Bollinger Bands. But to make things more precise, you could use the Bollinger Band Width indicator, shown in green below. The closer it is to zero, the tighter the bands and the less volatile the price. As the bands grow wider and the price gets more volatile, the indicator’s value goes up. Typically, the closer it is to zero, the bigger the move when volatility returns.

Walking the Bands
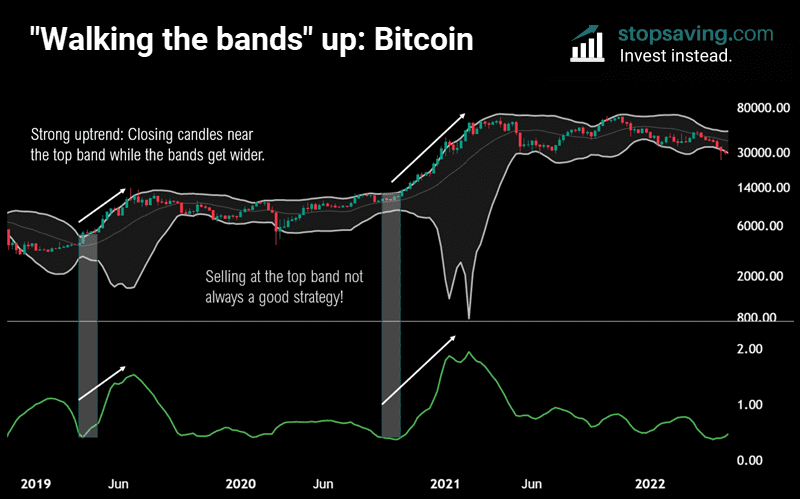
In powerful trends, the price can trade near the upper or lower Bollinger band as volatility rises. Here’s an example in the bitcoin weekly candle chart below. In early 2019, the weekly bands squeezed together. Volatility then came roaring back as the price trended higher over the next few months. The price was “waking the bands” as it closed weekly candles near the top band. The same thing happened in late 2020/early 2021. By walking the bands, you would have stayed invested without taking profits too early.
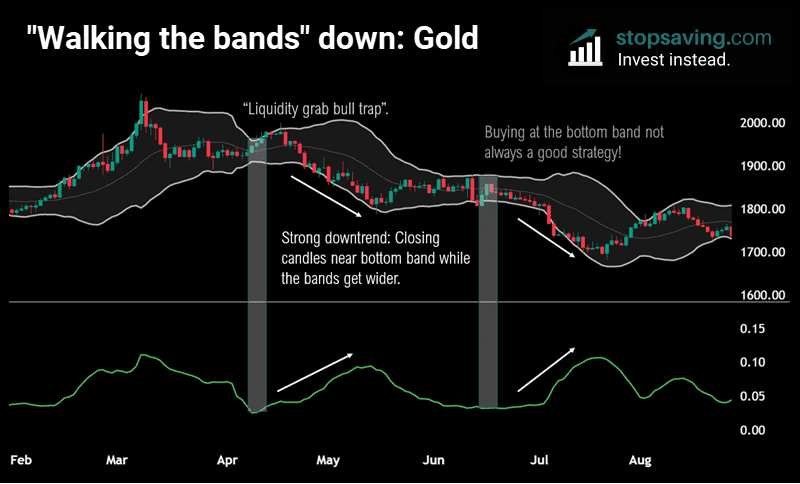
Just as you can “walk up” the top band in an uptrend, you can also “walk down” the bottom band in a downtrend. You can see this below with the gold daily candlestick chart.
That’s a wrap for this basic guide to Bollinger Bands. Check out this guide here to understand how to spot trend reversals with Bollinger Bands.
Like this content? Sign up for our free newsletter for how-to-guides and investment ideas across crypto, stocks, metals, and more!
This guide is part of our 100% free trading and technical analysis course.
Key Takeaways
- Bollinger bands are an all-rounder indicator.
- There are three Bollinger Bands: the Middle (20 SMA), upper (20 SMA plus two standard deviations of price movement), and lower (the 20 SMA minus two standard deviations of price movement). Wider bands mean more volatility.
- Roughly 89% of price movement is within the upper and lower bands, according to research from John Bollinger.