


Moving averages are among the most straightforward indicators in trading and investing. But they’re also one of the most useful, especially when determining the strength of a trend. Here, you’ll learn how to use moving averages for your trading or investment strategy. This guide comes in written, video, and PDF formats.
Video version of this guide
Watch the video version of this guide below, where I explain moving averages in detail.
PDF download for this moving averages guide
You can also download the PDF slide deck version of this guide below. This can be used to summarize the main concepts of the guide.
What’s a simple moving average?
A simple moving average (SMA) is a line that shows the general trend of investment by cutting out the noise. But unlike straight trendlines, moving average lines twist and turn as price action evolves. That’s because they connect the average closing prices over the last X number of trading periods (hours, weeks, days, or even months).
For example, the 50-day SMA updates daily to reflect the average closing price over the past 50 trading days. That means it will change tomorrow, but only slightly. Even though the price might move a lot in one day, the SMA line won’t move that much since we’re taking an average of 50 days. So, it smooths out the volatility to get a general direction of the trend.
There are two essential concepts to understand with moving averages. The first is the slope of the moving average. A steeper moving average slope means the trend is getting stronger. For example, note the steepening uptrend of the 50-week moving average for bitcoin in the chart below.
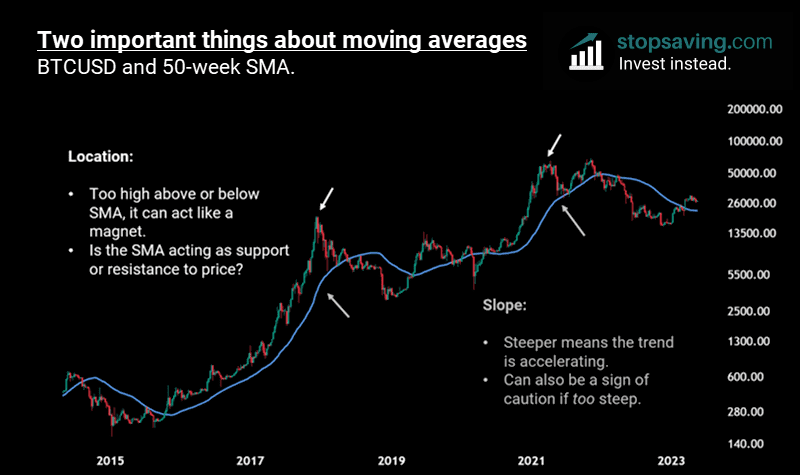
On the flip side, a steepening slope can also be a sign of caution. Notice how bitcoin’s 50-week moving average practically went vertical on two occasions in the chart above—and we all know what happened after.
The next important thing to understand about moving averages is the location of the investment relative to the moving average. Put simply, it’s better to buy when the price is closer to a moving average than when it‘s trading high above it. That’s because moving averages tend to act like a magnet. Eventually, they always catch up to the price.
You’ll also want to consider whether the price is above or below a moving average. That way, you can determine if the moving average is acting as price support or resistance.
How to choose the right moving averages for your trading strategy
There are many different moving averages to choose from. To decide which to incorporate into your strategy, you’ll first need to consider your trading time frame. For example, if you trade the hourly chart, use hourly moving averages. And if you trade the weekly chart, use weekly moving averages.
Next, choose a few moving averages within your trading time frame. Let’s use the weekly chart of bitcoin below as an example. You can see five moving averages here, ranging from the 10-week SMA (green) to the 200-week SMA (white). Notice how the 200-week SMA is the slowest, meaning it’s the least responsive to short-term price movement. The 10-week SMA is the fastest—or most responsive to recent price movement.

Shorter-term moving averages are more responsive to price changes than longer-term moving averages. If you’re using weekly time frames, the 10- and 20-week SMAs can be good options to help you “time the market.” Depending on the asset, there can often be good long-term opportunities to buy at or below the 200-week SMA!
Below are some SMAs for the bitcoin 1-day chart. For daily time frames, using the 10- and 20-day SMAs may cause you to trade too often. So, it’s probably better to focus on the 50-day SMAs and above—especially if you’d like to reduce trading costs.
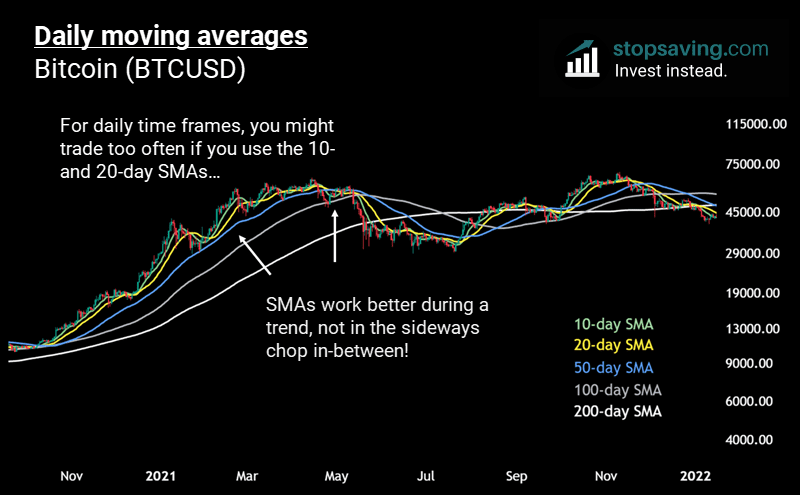
Notice how the moving averages got wider apart when bitcoin was in a strong trend but crisscrossed around when it was ranging sideways. Moving averages are much more helpful when the price is in a strong uptrend—so they’re great for trend and swing traders. But when the price ranges sideways, you’ll get “chopped around” if you rely on moving averages in your trading strategy. They’re not great for range traders.

What’s an exponential moving average (EMA)?
An exponential moving average (EMA) is like a simple moving average, except it weighs recent price action more heavily. That makes EMAs quicker to respond to price changes than SMAs (all else being equal). It doesn’t matter too much whether you use SMAs or EMAs. In case you’re wondering, I like to use a combination of the 8-EMA, 21-EMA, and 50 SMA for my strategies.
The bitcoin chart below shows three commonly used weekly EMAs. The 8-week EMA in green can act as price support in very strong uptrends and price resistance in very strong downtrends. Then there’s the 21-week EMA in yellow. The price usually starts to bounce off this line when the trend is still strong, but not as strong as with the 8-week EMA. Finally, there’s the 55-week EMA. This is a good one for longer-term investors to focus on.

Now, check out the weekly chart for the US dollar index (DXY) below. Again, notice how the 8-week EMA held as price support when the trend was at its strongest. You would’ve done well here buying the index on the way up when it tested the 8-week EMA as support. Meanwhile, buying near the 21-week EMA would’ve given you fewer trades but kept you invested for most of the rally (assuming you only exited after two weekly candle closes below it). The 55-week EMA does well in tracking the longer-term trend of the index.

Moving average crosses
A moving average cross is when a faster moving average crosses (and closes) over or under a slower moving average. Let’s use the weekly Nasdaq chart below to explain this phenomenon. Moving average cross strategies tend to work better with longer trading time frames—especially in markets that trend up over time. Take this strategy below: buy the Nasdaq whenever the yellow 21-week EMA crosses above the 50-week SMA.
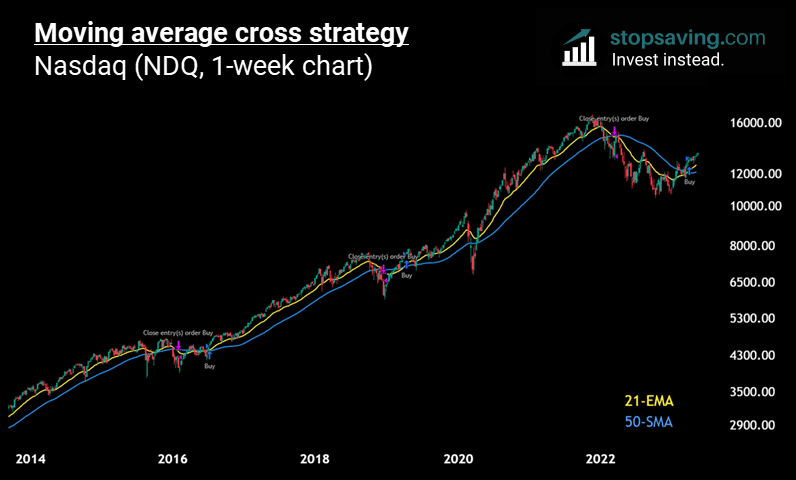
I did a more extensive study on this particular moving average cross strategy here.
Like this content? Sign up for our free newsletter for how-to-guides and investment ideas across crypto, stocks, metals, and more!
This guide is part of our free trading and technical analysis course.
Key takeaways
- A simple moving average (SMA) is a line connecting the average closing prices over the last X number of periods. Those can be hours, days, weeks, or even months.
- An exponential moving average (EMA) is like an SMA, but it puts more weight on recent price action (and is more responsive to it).
- Moving averages are simple yet powerful tools to incorporate into your trading strategy. They can tell you about the strength of a trend.
- Pick a moving average (or set of moving averages) that suits your trading style and time frame.
- A moving average cross is when a faster moving average crosses (and closes) over or under a slower moving average.