RSI vs Stochastic RSI: Which Should You Use?
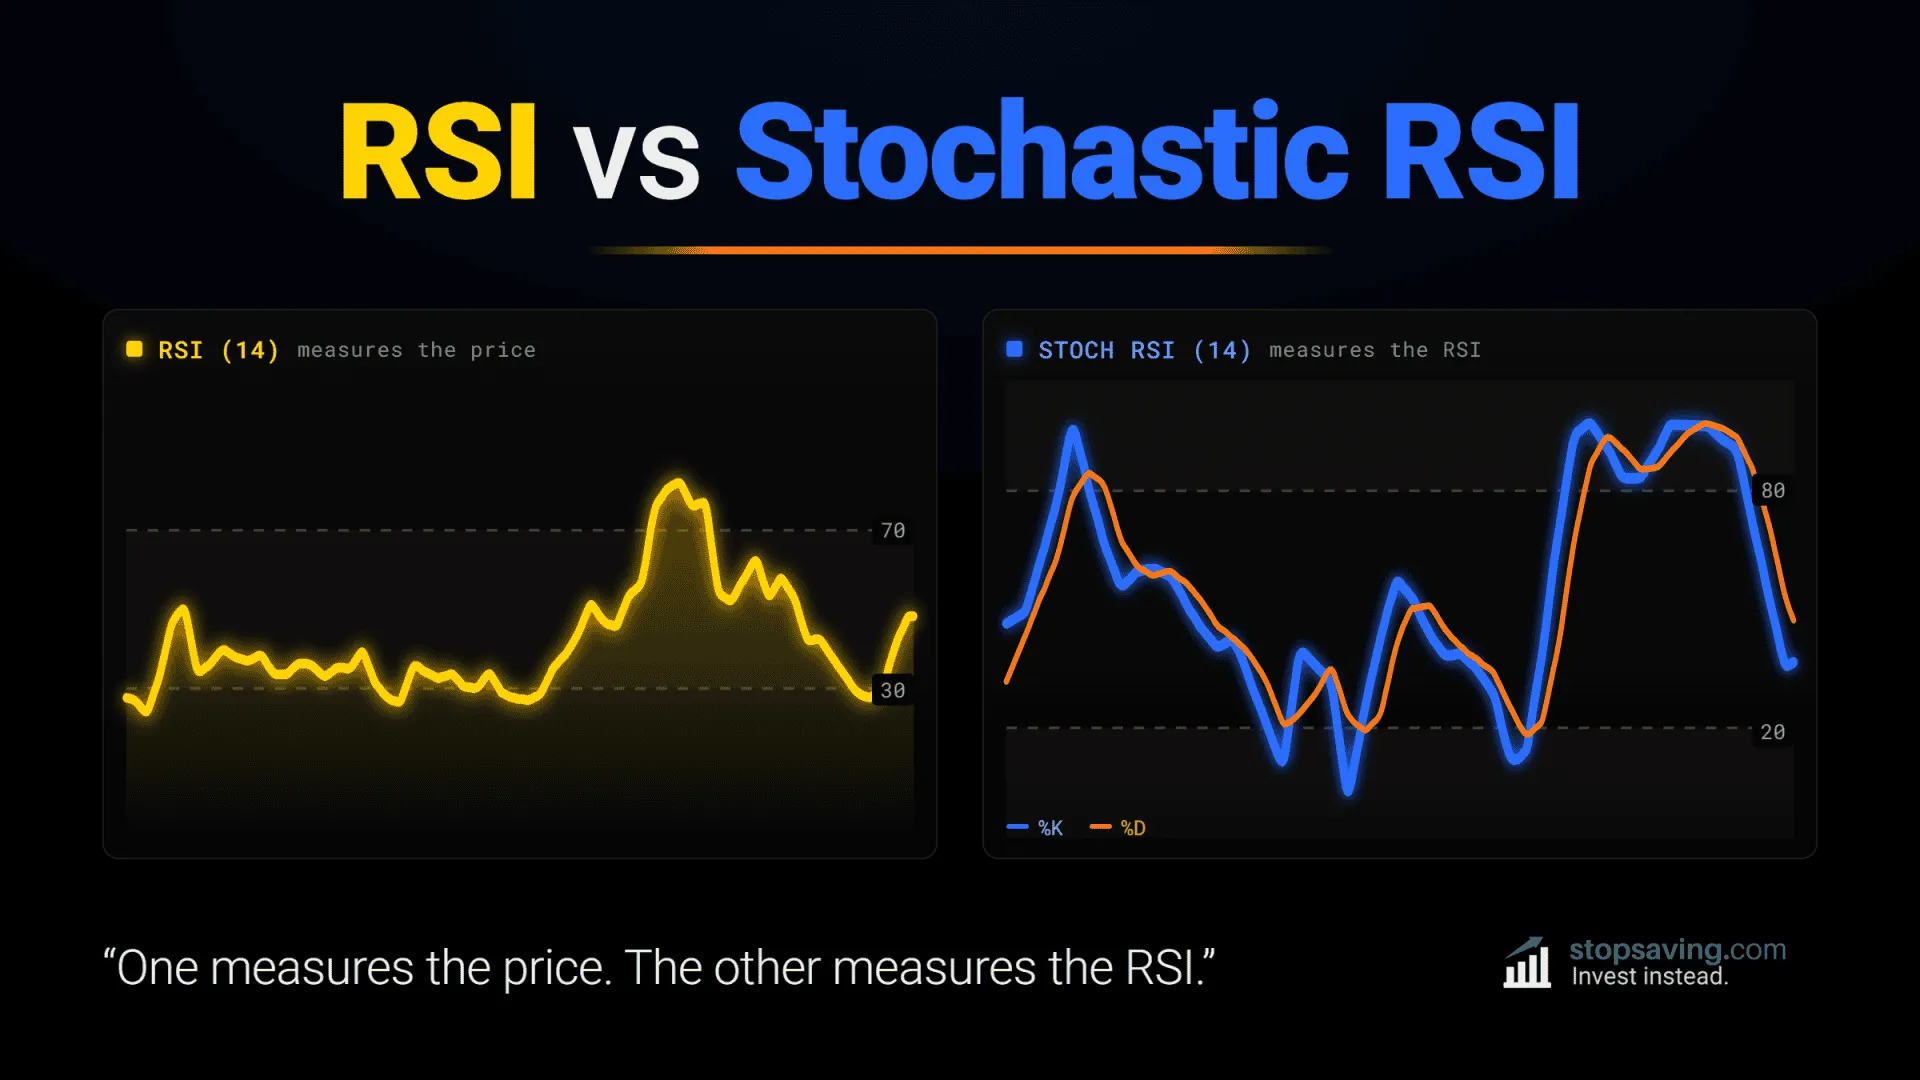
RSI vs Stochastic RSI: one measures the price, the other measures the RSI. Here's the difference, and which one fits your trading....
READ MORE
 Stopsaving.com
RSI vs Stochastic RSI: one measures the price, the other measures the RSI. Here's the difference, and which one fits your trading....
READ MORE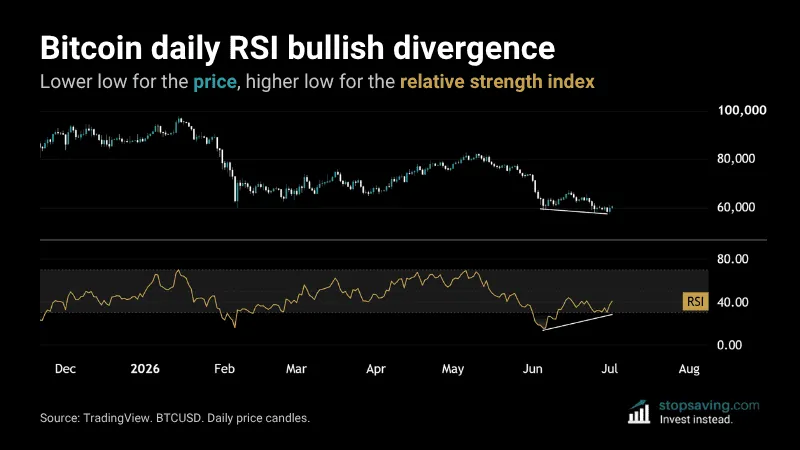
A bitcoin RSI bullish divergence shows sellers losing power. The daily signal is in near $60,000 – the weekly could be next....
READ MORE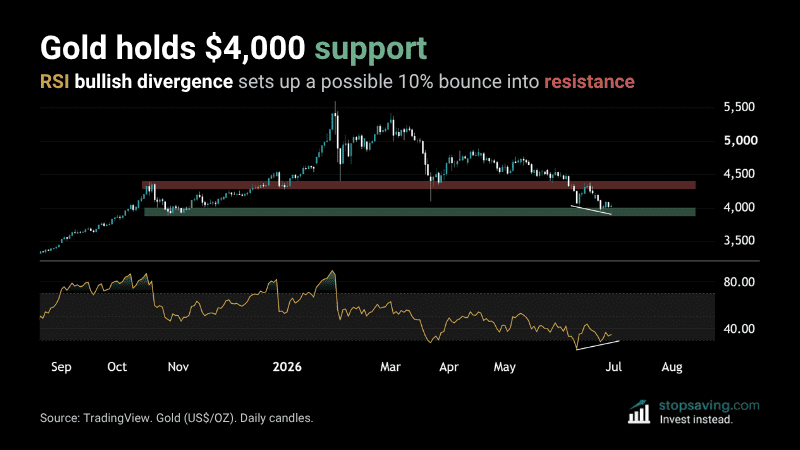
Gold could bounce 10% from $4,000 support. 3 reasons it's a poor spot to short, even with the bigger trend still down....
READ MORE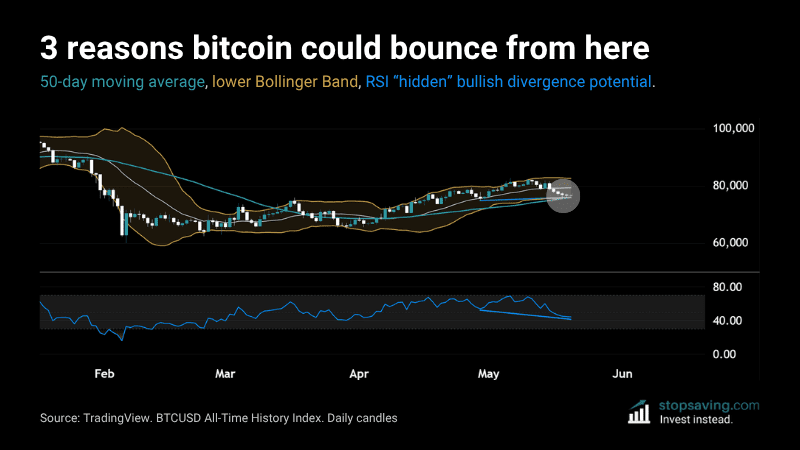
Bitcoin has fallen 8% from its early May high near $82,000. Here are 3 reasons the pullback could be over – and a bounce could be near....
READ MORE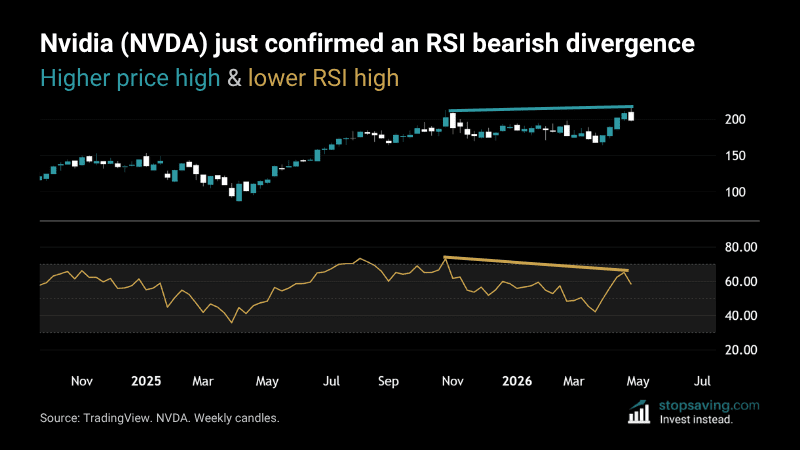
Nvidia just confirmed a bearish RSI divergence on the weekly chart. With Nvidia at 8% of the S&P 500, this is one to watch....
READ MORE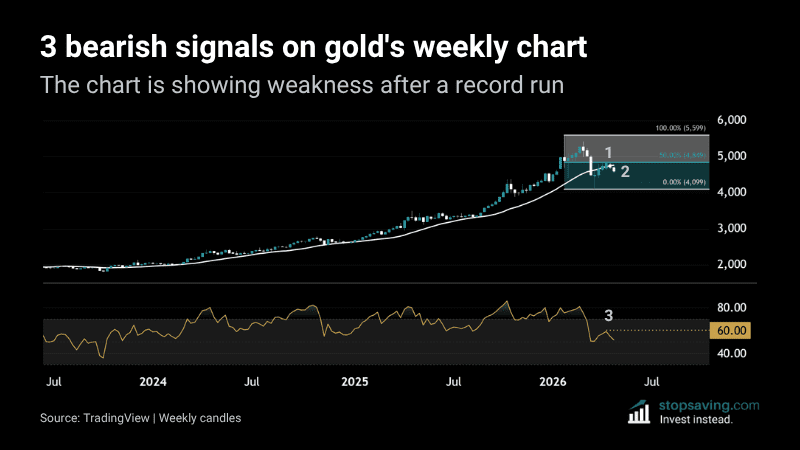
Gold has stalled below $5,000 after a huge run. Here are three bearish signals showing up on the weekly chart right now....
READ MORE
If you’re wondering whether the crypto market is overheated, the crypto RSI heatmap can help. Here's a guide to using it....
READ MORE
The crypto RSI heatmap shows almost every major coin in the oversold or weak zone. The average RSI is 37.81. Here's what to make of it....
READ MORE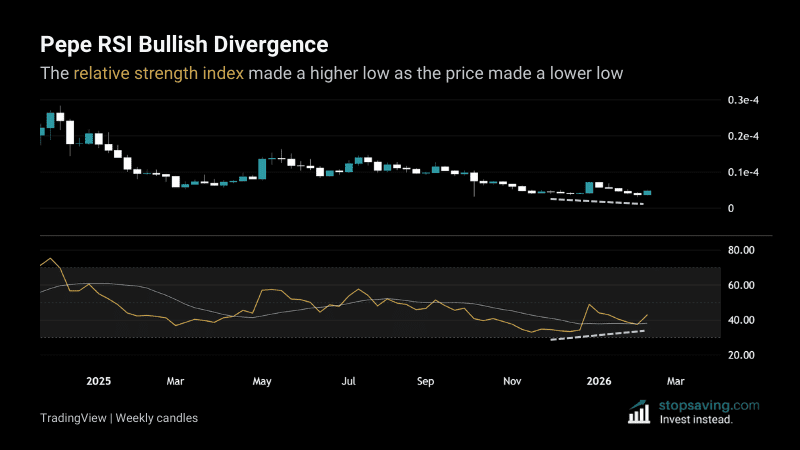
Pepe RSI bullish divergence forms on the weekly chart. Is crypto risk appetite starting to trickle back into crypto?...
READ MORE
Bitcoin’s weekly RSI hits a rare oversold level near historic lows. What this signal has meant for investors in past cycles....
READ MORE