

Pepe RSI Bullish Divergence – Crypto Risk Appetite Back?
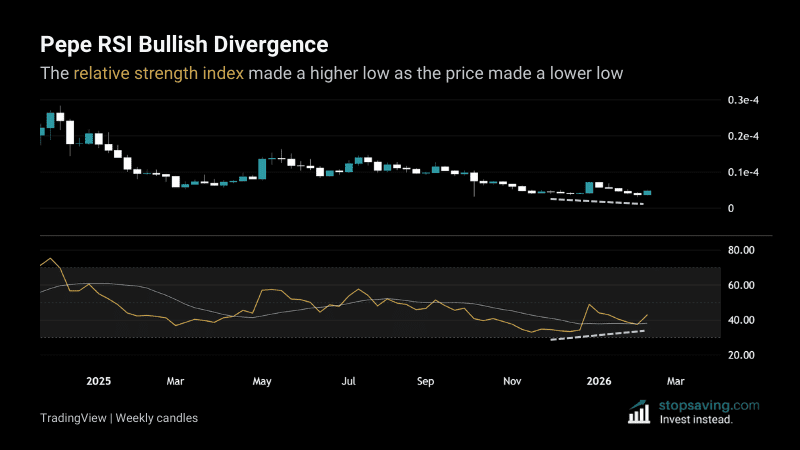
Pepe rallied about 27% yesterday, and is now up over 50% since bitcoin bounced at $60,000. This chart suggests there could be more upside for the memecoin – and crypto risk appetite is trickling back.
The Pepe chart shows weekly RSI bullish divergence
The chart shows Pepe’s RSI (relative strength index) in gold. Each point on the RSI line uses the price moves of Pepe over the past 14 weeks. If the average gains of “up weeks” outweigh the average losses of “down weeks”, the RSI goes higher. Then buying pressure gets “relatively stronger” than selling pressure (according to the indicator).
While the price of Pepe made a (slightly) lower low, the RSI made a higher low. That’s a bullish divergence. So buying pressure got stronger under the surface, even though the price drifted a bit lower.
That buildup of buying pressure has now started to release. And Pepe is rallying.
What could this mean for crypto investors?
Pepe has no utility (it’s a memecoin). But many crypto investors don’t care about that – they mostly buy it to get high crypto “beta”. When investors have more risk appetite, Pepe often rallies more than other tokens. And when they get defensive, Pepe can get hit a lot harder.
So keep an eye on Pepe. It might not change the world with its tech, but it can help you gauge the general crypto sentiment.
And if you can stomach the volatility, it’s not bad for swing trading either.
As usual, none of this is investment advice. To learn more about the RSI, check out our RSI Explained guide.



