

3 Bearish Signals on Gold’s Weekly Chart
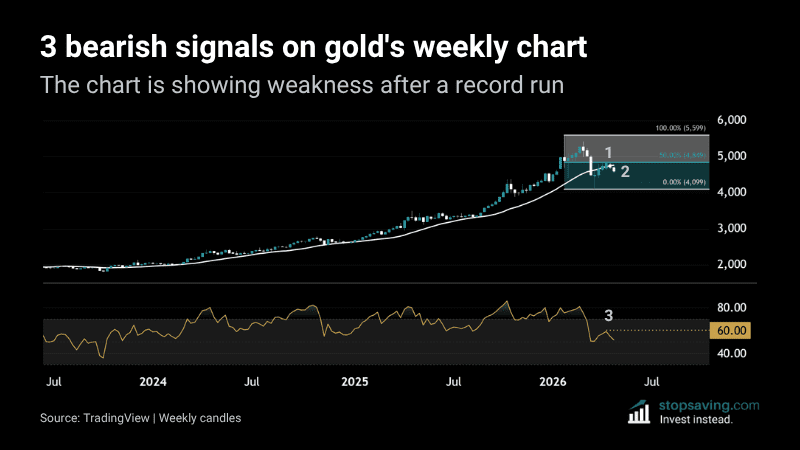
Gold started 2024 near $2,000 an ounce – then peaked at $5,599 on 29 January this year. That’s roughly 180% in just over two years. But the rally has stalled. And the weekly chart is now flashing three bearish signals at the same time.
1. The 20-week moving average has flipped to resistance
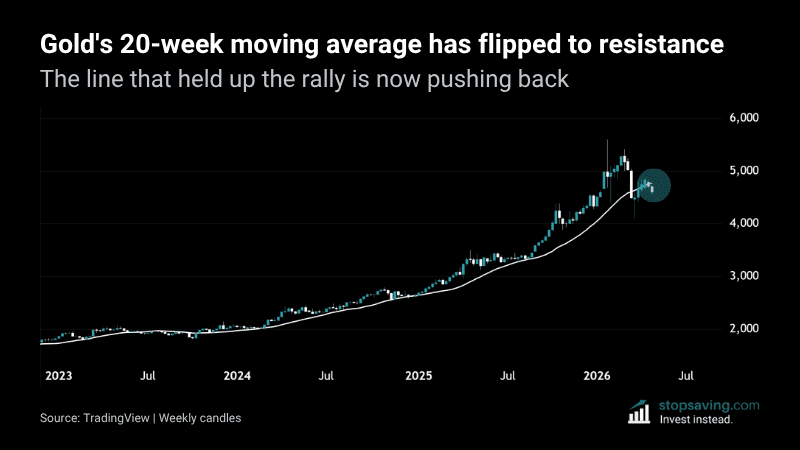
Gold is now trading below its 20-week moving average – a line that held up the entire rally from $2,000. The same line that used to support the price is now pushing it back down.
A moving average tracks the average price over a set period. When a major moving average flips from support to resistance, that’s a change in investor behavior.
2. Gold rejected at the 50% Fibonacci retracement level
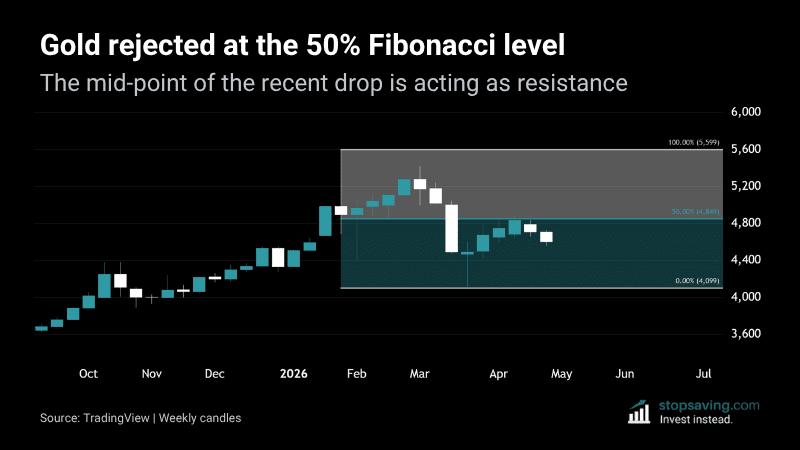
Gold briefly pushed above $4,849 in April before getting rejected. That’s the 50% Fibonacci retracement level of the drop from the 29 January high ($5,599) to the 23 March low ($4,099).
A Fibonacci retracement measures how far a price pulls back from a recent move (in the opposite direction of that move). The 50% level often acts as resistance after a big drop. When the price rejects there, it means buyers couldn’t even reclaim half of the drop.
3. The RSI rejected at 60
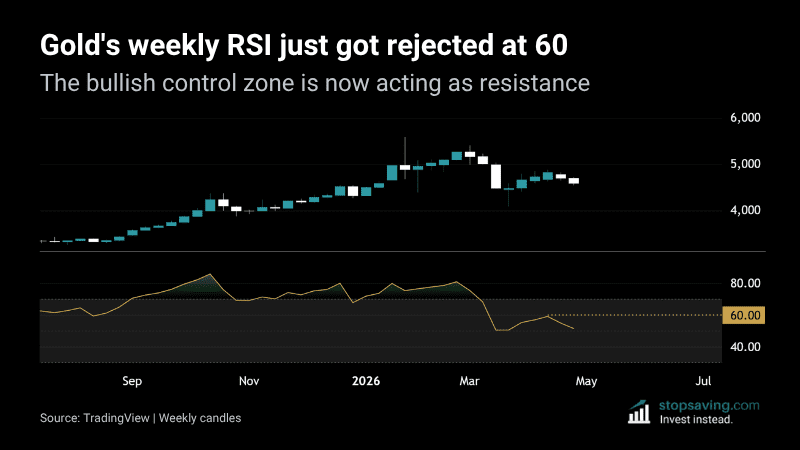
Gold’s weekly RSI tried to climb back above 60 in April and got rejected. After spending months in overbought territory (above 70) through late 2025, selling pressure has taken over.
The relative strength index (RSI) measures the relative strength of buying pressure versus selling pressure. The “bullish control zone” is above 60 – where buyers are “in control”. Until the RSI reclaims 60 on a weekly close, the bullish case for gold is on hold.
Key takeaways
- Gold’s 20-week moving average has flipped from support to resistance.
- Gold rejected at the 50% Fibonacci level of its January-to-March drop.
- The weekly RSI just got rejected at the 60 line.
As usual, none of this is investment advice. To learn more about how these signals work, check out our free technical analysis course.



