

Intel (INTC) Broke a 26-Year Resistance Ceiling
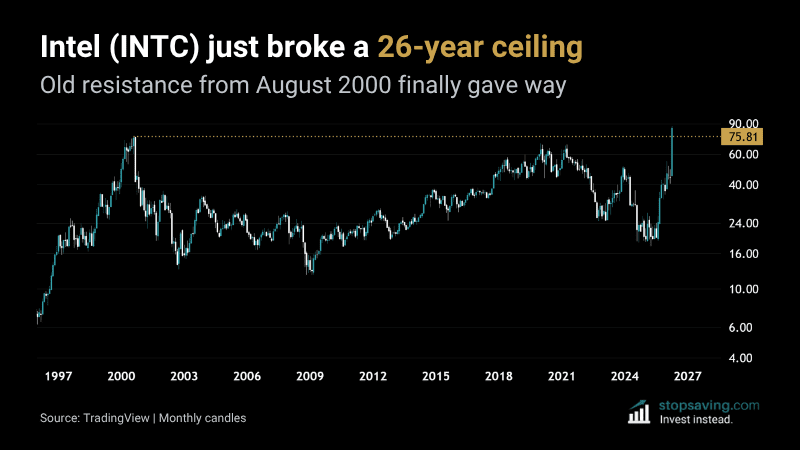
Intel just broke above its August 2000 all-time high after 26 years. Anyone who bought Intel at the dot-com peak waited 26 years to get back to break-even. Last Friday’s weekly close above the old high finally got them there. The stock is now up almost 400% from its April 2025 low.
What was Intel’s dot-com high?
Intel’s dot-com peak was $75.81, set intraday on 28 August 2000. The stock closed that day at $73.94 before rolling over with the rest of the tech bubble. The price wouldn’t see those levels again for 26 years.
Resistance is where sellers turn up to push the price back down. The more times a level holds, the stronger it gets. Intel tried and failed to break through in 2020 and again in 2021. Each rejection made the level more meaningful for chart watchers.
On 24 April this year, Intel ripped about 24% in one day after a seriously good Q1 earnings report. Analysts expected $0.01 in profit per share – but Intel made $0.29. The Data Center and AI division grew 22% from a year ago. Google and Nvidia are now using Intel’s chips in their AI systems.
There’s a lesson in this. Waiting 26 years just to get back to break-even is a brutal reminder of opportunity cost. The same money in the S&P 500 over those 26 years would have grown by around 800% – roughly 9x the original investment. Sometimes the grass is greener with other investments.
What to watch next on the Intel chart
Intel could certainly go higher, but it’s now a question of risk versus reward. Breakouts often retest the level they broke through. If Intel pulls back to $75 or so and holds the line, that could make for a “safer” entry than buying into the hype.
Now that Intel has broken the resistance, you’ll want to see it morph into support.
As usual, none of this is investment advice. To learn more about how breakouts work, check out our Support and Resistance Explained guide.



