Nvidia Volatility is Rising (From a 4-Year Low)

Nvidia stock’s volatility – measured by the weekly Bollinger Bands – reached a four-year low earlier this month. And after Wednesday’s earnings report, that volatility is now starting to make a comeback. When volatility returns after being ultra low, it usually overcompensates – that’s how volatility works. In other words, Nvidia Stock (NVDA) could be gearing up for a relatively big move.
How does the Bollinger Band Width indicator measure Nvidia’s volatility?
The chart shows Nvidia’s stock price at the top, with each candle representing one week of price movement. The Bollinger Bands around the candles measure the stock’s volatility relative to its 20-week moving average (middle band). When the bands are closer together, it means Nvidia’s week-to-week price moves (up or down) are more muted.
Narrower bands mathematically imply lower volatility – and the Bollinger Band Width indicator at the bottom can measures this. As you can see, it just clocked its lowest reading since February 2021.
What could this mean for Nvidia’s stock price?
Bollinger Bands expand and contract like a coiled spring – the tighter it gets, the bigger the snap when it finally releases. And now those bands are beginning to release (the Bollinger Bands are getting wider). This suggests Nvidia could get a lot more volatile in the weeks and months ahead.
But that volatility could come to the upside or the downside. Four years ago it was clearly to the upside, but now, that’s not so certain.
Fundamentally, Nvidia just posted a seriously strong earnings report for its last financial year (ending 31 January, 2025). Compared to its last financial year, revenue jumped 114% to $130.5 billion. And its net income (revenue minus costs) also more than doubled (from $29.8 billion to $72.9 billion). Big tech companies like Amazon, Google, and Microsoft rely on Nvidia’s GPUs (graphics processing units) to power their AI data centers. The company has a solid business model – which “should” be good for its stock price.
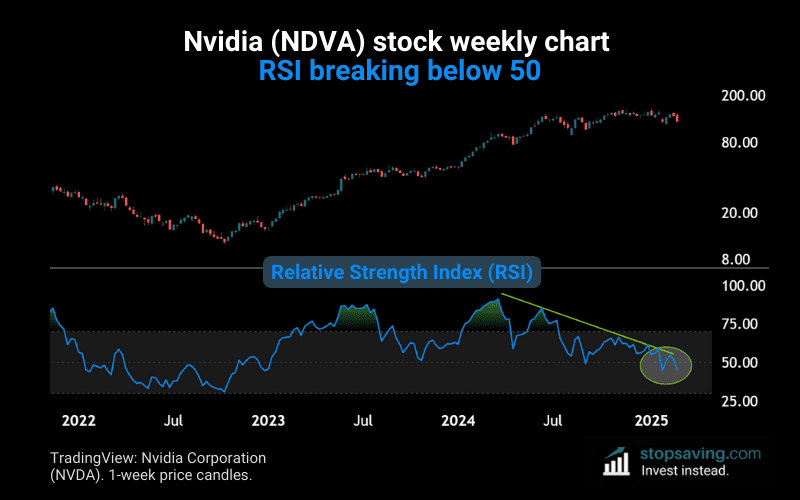
But technically, things don’t look so hot for Nvidia, with the trend losing momentum. The weekly RSI (relative strength index) is now breaking below 50 for the first time since March 2022. The RSI measures the average gains of “up weeks” against the average losses of “down weeks” over the past 14 weeks. Now that it’s below 50, the losses are starting to outweigh the gains.
If bulls and bears were in a tug-of-war, the bears would now be pulling harder.
As usual, none of this is investment advice. If you liked this analysis, check out my free newsletter for how-to guides and investment insights across crypto, stocks, metals, and more.