Bitcoin’s 200-Day Moving Average Test: CME Futures on the Line

The price of CME Bitcoin Futures (BTC1!, TradingView) is down roughly 30% since January 21st. Now, it’s testing the 200-day moving average (SMA) – a key support level since the bitcoin bull run began in 2023. For bitcoin’s uptrend to stay intact, you’ll want to see the 200-day SMA hold.
Why CME Bitcoin Futures matter
CME Bitcoin Futures track the bitcoin price and trade on the regulated Chicago Mercantile Exchange (CME). Many institutional traders use them to get exposure to bitcoin’s price swings without owning the actual asset (spot). Unlike spot bitcoin, which trades 24/7 on crypto exchanges, CME Bitcoin Futures are closed on weekends. And because they cut out choppy weekend price action, some traders prefer using them for technical analysis.
Speaking of technical analysis, the futures price is now bouncing off the 200-day SMA (gold line, chart below). This moving average updates daily to show the average price over the past 200 days. It’s not always perfect, but buying bitcoin near the line has worked out rather well since early 2023. But in the 2022 bear market, not so much – the moving average was a price ceiling then (instead of a floor). The line also sloped downward, too, showing stronger selling momentum.
Looking at the spot bitcoin price below, things lean a bit more bearish for now. That’s because it’s already trading below the 200-day moving average (teal line):
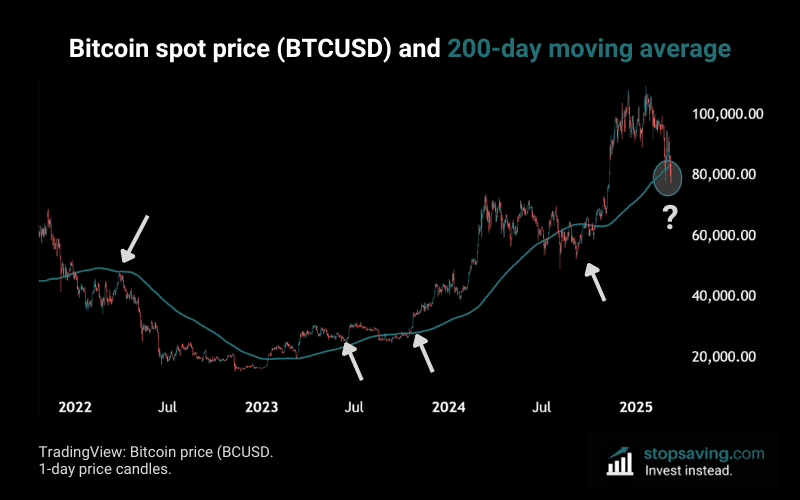
If bitcoin still has more fuel in the tank in this cycle, reclaiming the 200-day moving average is key.
To learn more about how to trade using moving averages, download our free PDF guide below:
As usual, none of this is investment advice. If you liked this analysis, check out my free newsletter for how-to guides and investment insights across crypto, stocks, metals, and more.