Bitcoin RSI Bullish Divergence Builds the Bottom Case
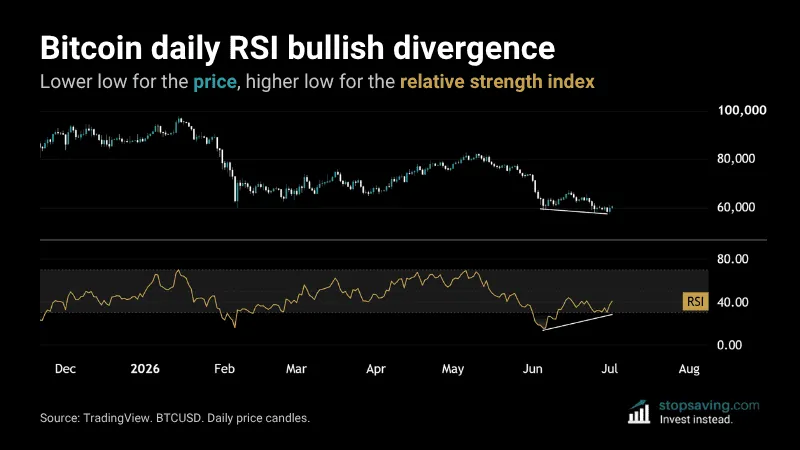
A bitcoin RSI bullish divergence shows sellers losing power. The daily signal is in near $60,000 – the weekly could be next....
READ MORE
 Stopsaving.com
A bitcoin RSI bullish divergence shows sellers losing power. The daily signal is in near $60,000 – the weekly could be next....
READ MORE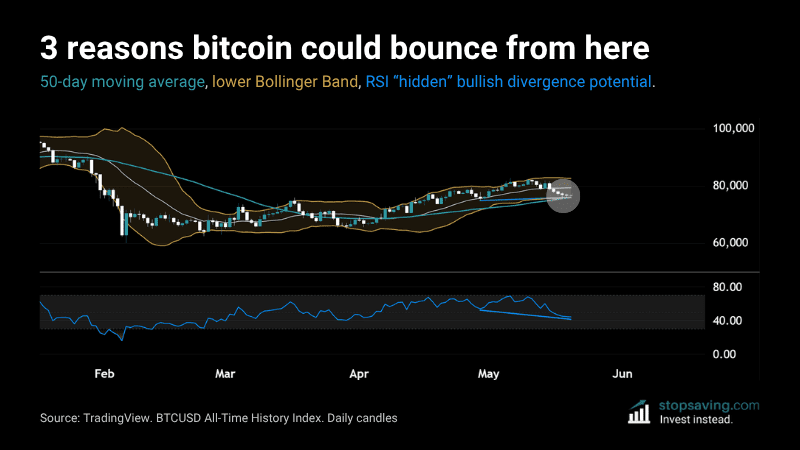
Bitcoin has fallen 8% from its early May high near $82,000. Here are 3 reasons the pullback could be over – and a bounce could be near....
READ MORE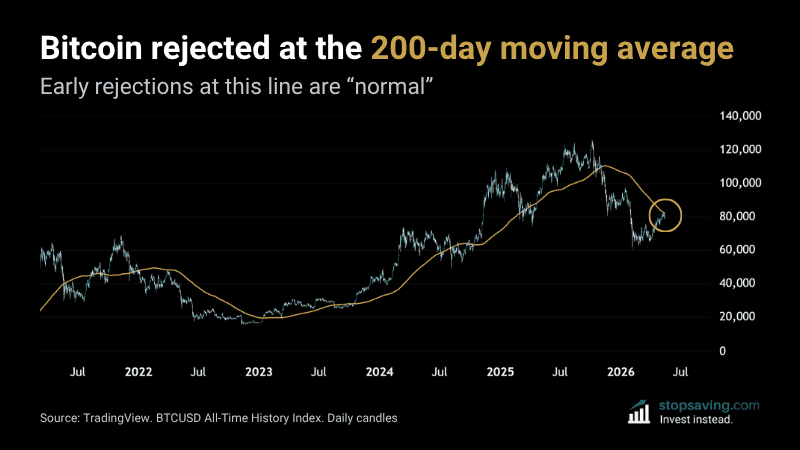
Bitcoin just got rejected at the 200-day moving average after a 37.72% rally. Here's why early rejections are normal – and why they're OK....
READ MORE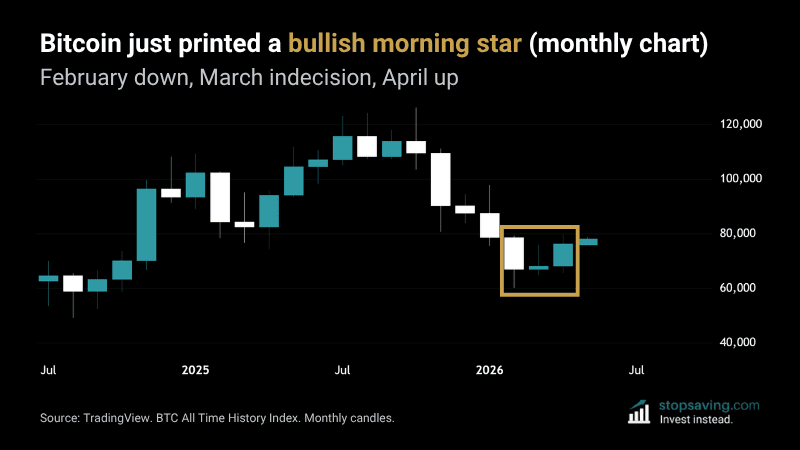
Bitcoin's monthly chart just printed a textbook bullish morning star. Three months, three candles, one big reversal signal....
READ MORE
Bitcoin has been trading tentatively higher since tagging $60K in early February. But on the weekly chart, a clean broadening wedge is taking shape. If you’re looking for a bullish bitcoin scena...
READ MORE
Bitcoin’s weekly RSI hits a rare oversold level near historic lows. What this signal has meant for investors in past cycles....
READ MORE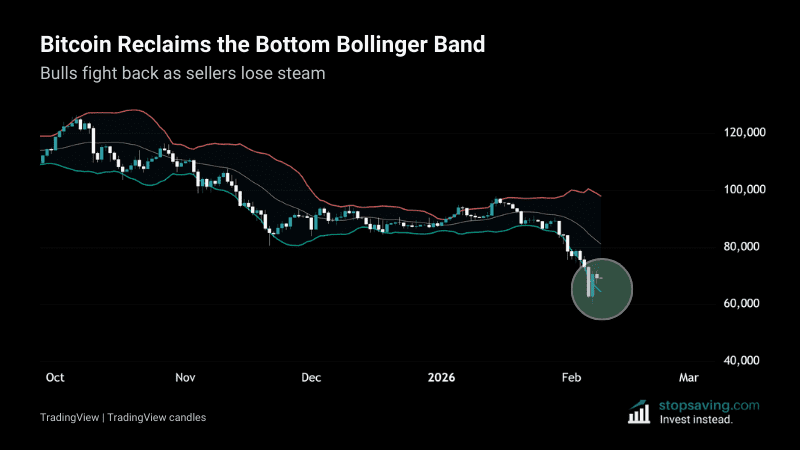
The bitcoin price has closed back above the lower Bollinger Band on the daily chart – a sign that are tiring. ...
READ MORE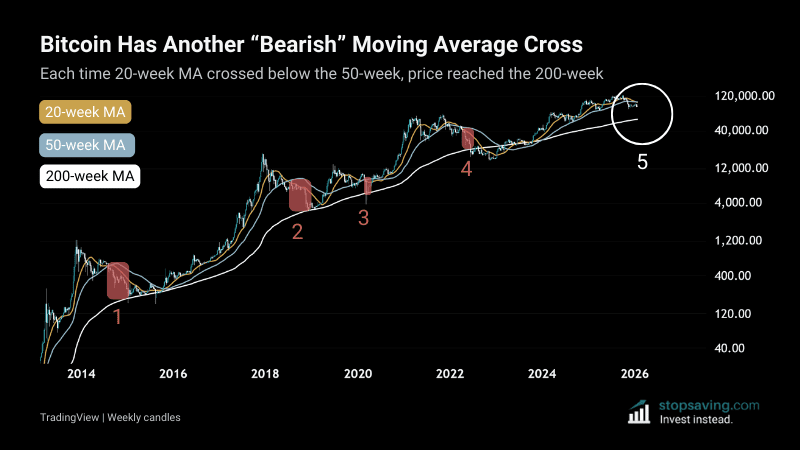
Bitcoin has printed another bearish moving average cross on the weekly chart. Here’s how similar setups played out historically....
READ MORE
This chart shows three drives of bearish divergence between the bitcoin price and its relative strength index (RSI)....
READ MORE
Bitcoin dominance bounced at the bottom Bollinger Band. The bounce suggests bitcoin may outperform altcoins in the short term....
READ MORE