

Bitcoin Reclaims the Bottom Bollinger Band
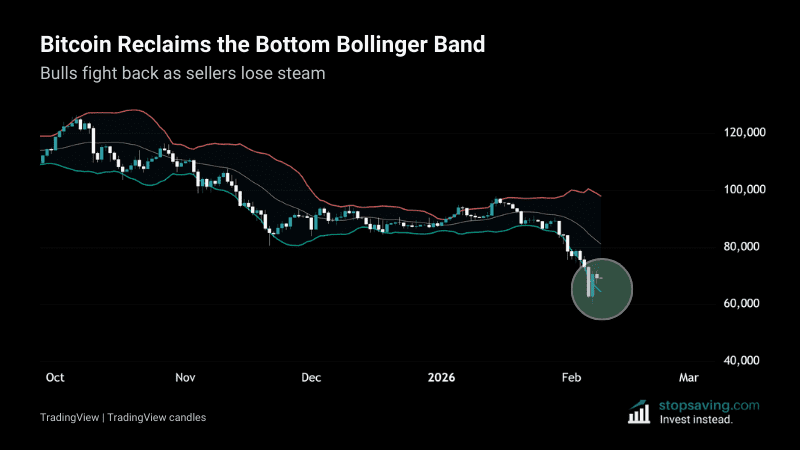
After bitcoin hit $60,000 this week, buyers stepped in. The price then closed back above the lower Bollinger Band (green) – a sign that sellers are tiring. That doesn’t promise the low is in, but it’s an important win for the bulls. Here’s why.
The chart explained: Bitcoin’s bottom Bollinger Band
The chart shows the daily price candles of bitcoin since the price peaked at $126,000 in October. Notice how the price trended down in “steps” over that time. The last step down was the biggest – where the price has traded consistently near the bottom Bollinger Band.
On Thursday, the price closed further below the bottom band than at any point since the sell-off began. And on Friday, the price flushed even lower – before closing back above the bottom band.
The takeaway
Bollinger Bands get pulled wider when volatility rises, and narrower when volatility drops. When volatility is increasing to the downside, the lower band does the pulling. So when the price snaps back above the lower band, the sellers effectively start to “let go” of the band. In other words, bitcoin reclaiming the bottom band shows that downside volatility is slowing down after reaching extremes.
If downside volatility is slowing, the buyers have a chance to regain some momentum.
Interestingly, bitcoin bounced at the $60,000 level. That was also the average electricity cost to mine bitcoin, according to the Bitcoin Production Cost Indicator.
As usual, none of this is investment advice. To learn how to use Bollinger Bands in your investment strategy, check out our Bollinger Bands Explained guide.



