

Bitcoin Just Printed a Bullish Morning Star (Monthly)
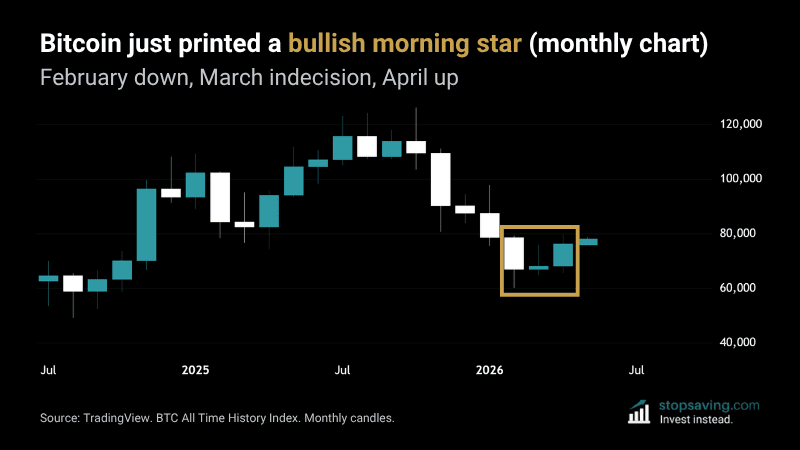
Bitcoin’s monthly chart just printed a textbook bullish morning star candle sequence. February closed deep in the red at $66,993.86. March was a small indecision candle, closing at $68,226.39. April closed strong in the green at $76,318.70.
Three months, three candles, and one of the cleanest reversal patterns you can ask for on a monthly chart.
How the bullish morning star works
A bullish morning star is a three-candle reversal pattern. Sellers control the first candle, the second is indecision, then buyers take over the third. When you see this sequence at the bottom of a downtrend, it means power has switched from sellers to buyers.
Look closer and the candles tell their own bullish story. The intramonth wick lows climbed each month – February ($60,132.75), March ($64,960.67), and April ($65,692.29). That means buyers stepped in earlier each time.
The intramonth highs worked out well, too. April’s wick high of $79,498.80 pushed above February’s $79,369.55. So, April made a higher low and a higher high than February’s red candle.
On top of that, April’s close at $76,318.70 finished above March’s wick high of $76,008.43.
Buyers absorbed every price March sellers could throw at them.
What this means for bitcoin investors
A monthly morning star is one of the strongest reversal signals on the highest timeframe most investors look at. The more time it takes to make the candle, the harder the pattern is to fake.
A monthly candle takes 30 days of buying and selling. Sellers won February, March was a draw, and buyers won April.
For long-term investors, that changes the picture. If we get short-term pullbacks in May or June, those could be dip-buying opportunities. Not reasons to panic.
As usual, none of this is investment advice. I can be wrong, just like everyone else. To learn more about candlestick patterns, check out our Candlestick Charts Explained guide.


