

Bitcoin Rejected at the 200-Day Moving Average – That’s OK
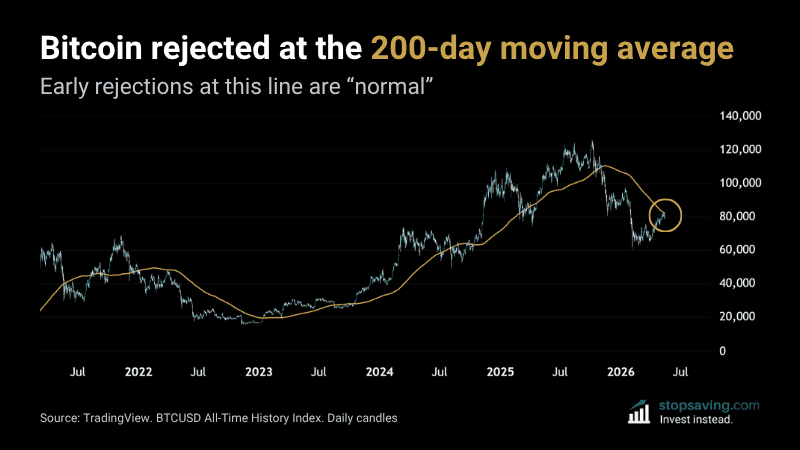
Bitcoin has rallied 37.72% off the 6 February low. The rally hit its peak on 6 May and got rejected just below the 200-day moving average. Bitcoin tried to break the moving average again on 10 May and got rejected again. The line is now acting as resistance at around 82,000. Early rejections at this level are normal. They can also set up something more interesting.
Price source: TradingView. BTCUSD All-Time History Index.
Why early rejections at the 200-day are normal
The 200-day moving average is one of the most-watched lines in markets. It tracks the average daily closing price over the last 200 days. Investors use it as a long-term trend gauge. Bitcoin has spent 192 full days below the 200-day moving average so far.
When a price comes back up to test the 200-day from underneath, plenty of traders take profits there. Short sellers also tend to pile in at the line, betting it’ll hold as resistance.
That’s why early rejections at the 200-day happen so often. The level acts like a ceiling – and breaking it often takes a few punches.
What would make this bullish
Right now the 200-day moving average is resistance, not support. Technically, that’s “bearish”. Buying directly below it isn’t always the best risk-to-reward.
The ideal setup would go something like this. Bitcoin pulls back, makes a higher low, then comes back up to chip away at the 200-day. A few more rejections might follow – who knows. But with enough pressure from the buyers, the ceiling eventually breaks.
Bitcoin has stayed below the 200-day MA for longer before. But it always got back above it in the end – and then some.
You can track this in real time on TradingView. Pull up the daily BTCUSD chart and add the 200-period simple moving average.
As usual, none of this is investment advice. I can be wrong, just like everyone else. To learn more about how moving averages work, check out our Moving Averages Explained guide.



