Solana Bounces Off Support – 20-Week Moving Average Above

After hitting $295.11 in January, Solana (SOL) crashed to $130.51 in February – down 55.78%. So far, SOL is bouncing off a major support region between $125 and $135 (green, in the chart). That said, Solana is now trading well-below its 20-week moving average (SMA, gold) – which could become resistance.
Is Solana bullish or bearish?
Buying near major price support can be a sound strategy from a risk-to-reward standpoint. Because if that support breaks, you can exit the trade without taking too big of a loss. Many pro traders have that mindset, which creates a self-fulfilling prophecy – prices tend to bounce near support simply because pro traders buy there. So on that basis, Solana might be due a bigger bounce. It’s also down over 50% in a few weeks – and dip buyers love a dip. So there’s that.
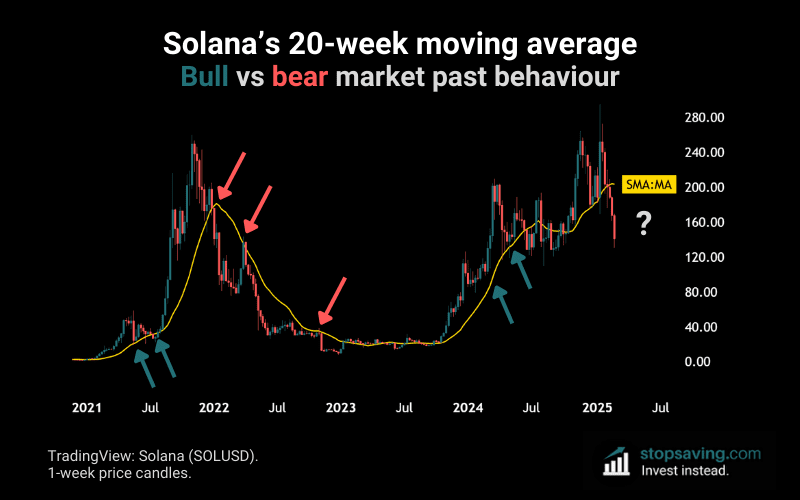
Still, as long as Solana trades below its 20-week SMA, it’s hard to be long-term bullish. It’s not a perfect signal, but as the chart below shows, it’s done a decent job separating bull and bear markets.
Bull markets: the 20-week SMA tends to be support – holding up the price. The moving average also slopes upward most of the time.
Bear markets: the 20-week SMA tends to be resistance – pushing down the price. It slopes down most of the time.
Bottom line: Solana’s current bounce could create a nice swing trade opportunity. But the bulls have some heavy lifting to get back on track.
As usual, none of this is investment advice. To learn more about moving averages and how they work, check out our free PDF guide below.