

How to Tell If the Next Bitcoin Breakout Isn’t a Fakeout

There’s an old saying among breakout traders: “Show me an all-time high, and I’ll show you a buy.” Bitcoin’s last all-time high was just below $112,000 (set in May), and it’s teasing that level again now. Here’s how to gauge if this possible bitcoin breakout could be the real deal – or just a fakeout.
How to tell if the bitcoin breakout is real
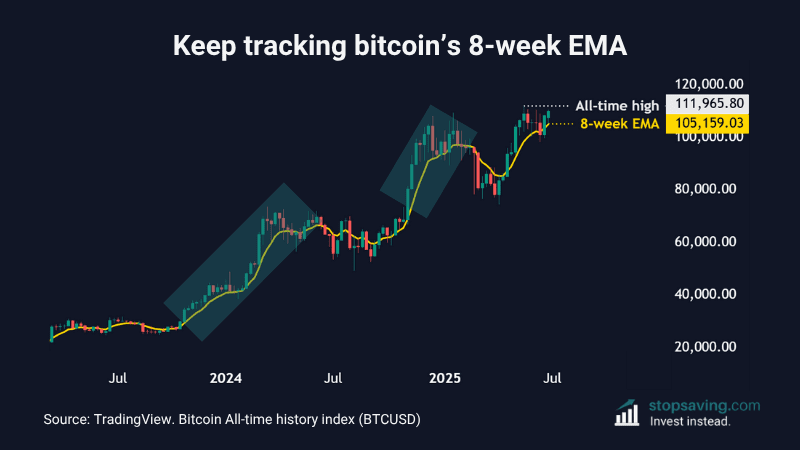
The chart shows the weekly price candles for bitcoin – meaning each candle represents one week of price movement. By using weekly candles (rather than shorter time frames), we take a longer-term view, which can give us a more powerful trading signal.
You’ll also notice a gold line in the chart: bitcoin’s 8-week exponential moving average (EMA). The line updates each week to track bitcoin’s average weekly closing price over the past eight weeks. But unlike a “simple” moving average (SMA), the EMA puts more weight on more recent weeks. So, like-for-like, the 8-week EMA is more responsive than the 8-week SMA.
In past bitcoin breakouts, the price has held above the 8-week EMA – with the line sloping upward and acting as price support. So long as bitcoin stays above it, there’s a good chance that the breakout is “real.”
How to tell if the breakout is “not” real
Not all breakouts end with big upside moves, especially with volatile investments like bitcoin. Sometimes breakouts become fakeouts – and “trap” late buyers in losing positions. Of course, you won’t know it’s a trap until it actually happens (that’s why it’s called a trap).
So if bitcoin makes a new high soon, here’s my thinking. The breakout would be real unless bitcoin closes a weekly candle back below the 8-week EMA. The EMA line is now sitting at about $105,000. If bitcoin pops above its all-time high and then closes the week back below $105,000, it’s probably a fakeout.
If you’d like to learn more about exponential moving averages, grab our free PDF guide below:



