

Bitcoin Just Confirmed a Classic Wyckoff Spring
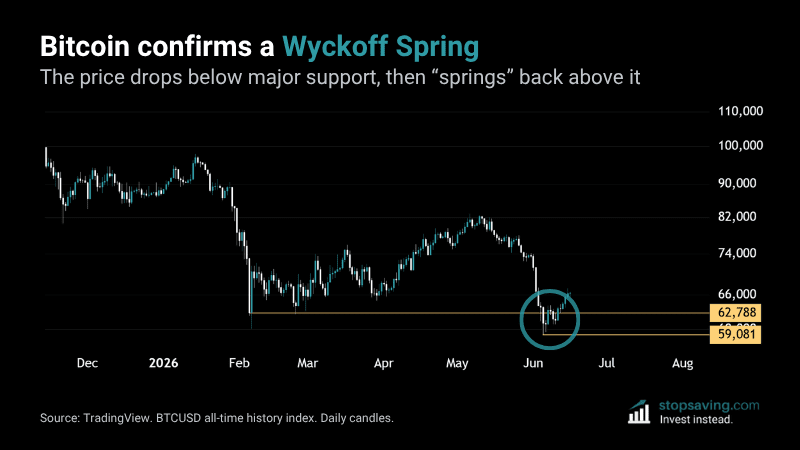
Bitcoin just confirmed a classic Wyckoff Spring – something you typically only see at major market bottoms. First, the price lost a huge support level that buyers had held for four months. It then spent a few days below that support, before “springing” back above the line. Here’s what it means for bitcoin, and what to look out for to keep the bull case intact.
How the Wyckoff Spring played out
The chart shows a golden horizontal line at $62,788. That’s the price bitcoin closed the day on February 5 of this year (TradingView, BTCUSD all-time history index). Bitcoin never closed another daily candle below that price for another four months. In other words, it held as major price support.
But that support broke down on June 5. Bitcoin closed the day below it – and dipped all the way down to $59,081 intraday. The price spent a few days trading below that support, only to then reclaim it by 11 June. That’s a textbook Wyckoff Spring.
What the Spring might mean for bitcoin
The price dropped below key support, investors panic-sold, and then the “smart money” scooped up their coins.
Many traders would also have set their stop-losses just below that support. When the price dropped to hit their stops, they became forced bitcoin sellers. That can bring extra selling liquidity into the market – giving “whales” (or big buyers) the ability to buy en masse.
As long as bitcoin holds above $62,788 on a daily close, the Wyckoff Spring is alive and well. And the bull case stays intact.
As usual, none of this is investment advice. To learn more about Springs, accumulation, and distribution, check out our Wyckoff Method guide.



