

What Is the Fear and Greed Index? Guide for Stocks & Crypto

The Fear and Greed Index can help you gauge whether the market is fearful or greedy on a given day. There’s a fear and greed index for the stocks, and another one for crypto. In this guide, we’ll unpack how each one works – and how to use them in your trading or investment strategy.
What is the Fear and Greed Index?
The Fear and Greed Index is a tool that tracks general investor sentiment. It gauges whether the market is leaning toward extreme fear (0) or extreme greed (100). Most (not all) investors tend to get fearful in falling markets and greedy in rising ones – that’s just human nature.
The index ranges from 0 to 100:
| Fear & Greed index value | Sentiment | What it might mean for investors |
|---|---|---|
| 0-24 | Extreme Fear | Markets are panicking. Could be a smart time to buy when others are scared. |
| 25-49 | Fear | Caution is in the air. Might be worth looking for bargains, but stay selective. |
| 50 | Neutral | No strong signals. Could be a good time to hold steady and wait. |
| 51-74 | Greed | Optimism is rising. Maybe take some profits or tighten up your risk. |
| 75-100 | Extreme Greed | Euphoria alert. Might be time to sell into strength before the music stops. |
CNN Fear and Greed Index for stocks

The CNN Fear and Greed Index is the go-to gauge for US stock market emotions. It tallies seven indicators (split equally) to get its final score:
1. Market momentum tracks how far the S&P 500 is from its 125-day moving average. The market is more greedy (or fearful) when the S&P 500 is further above (or below) that average.
2. Stock price strength compares how many NYSE stocks are hitting 52-week highs versus lows. More highs signal greed, while more lows point to fear.
3. Stock price breadth is based on the McClellan Volume Summation Index. It measures the difference between rising and falling trading volume. Rising volume suggests greed, and falling volume suggests fear (according to the index).
4. Put and call options activity can tell you a lot about investor sentiment. This part of the index takes the 5-day average put/call ratio. Investors tend to buy put options to protect downside (fearful) and call options to take advantage of upside (greedy). So the higher the ratio, the more puts versus calls – and the greater the fear.
5. Market volatility is another feature of the CNN Fear and Greed Index. This uses the CBOE Volatility Index (VIX) – known as “the fear gauge”. The VIX tracks expected stock volatility over 30 days (using options data). The higher the VIX climbs above its 50-day moving average, the scarier the market.
6. Safe haven demand typically goes up when investors are fearful – and they want to hold “safer” investments. This part of the index compares the performance of stocks (“riskier”) to US treasury bonds (“safer”) over the past 20-days.
7. Junk bond demand tracks investor appetite for riskier bonds versus safer government bonds. When bond investors take on more risk, there could be more greed in the stock market.

Crypto Fear and Greed Index

Crypto tends to be more volatile than stocks – and that makes it really emotional for investors. The Crypto Fear and Greed Index tracks those emotions with six indicators, each with its own weight:
1. Volatility (25%) creates a more fearful crypto market, according to the index. This part measures bitcoin’s current volatility and maximum drawdowns (worst-case loss from top to bottom) compared to the 30- and 90-day averages. More volatility and bigger price drops unleash more fear.
2. Market momentum/volume (25%) looks at bitcoin’s trading volume and momentum (again, compared to the 30- and 90-day averages). High buying volume in a rising market can be a clear sign of greed.
3. Social media (15%) tracks how often people tweet about “bitcoin” – and how much engagement those posts get. Greed and social media activity go hand in hand here.
4. Surveys (15%) are paused for now – so they’re not relevant to the score.
5. Dominance (10%) tracks bitcoin’s share of the total crypto market. Bitcoin is a safe haven asset in crypto (compared to altcoins) – its dominance can climb when the market is fearful.
6. Trends (10%) tracks Google search trends for bitcoin. More searches for things like “bitcoin crash” signals fear, while terms like “bitcoin price prediction” point to greed.
How to use the index in your strategy
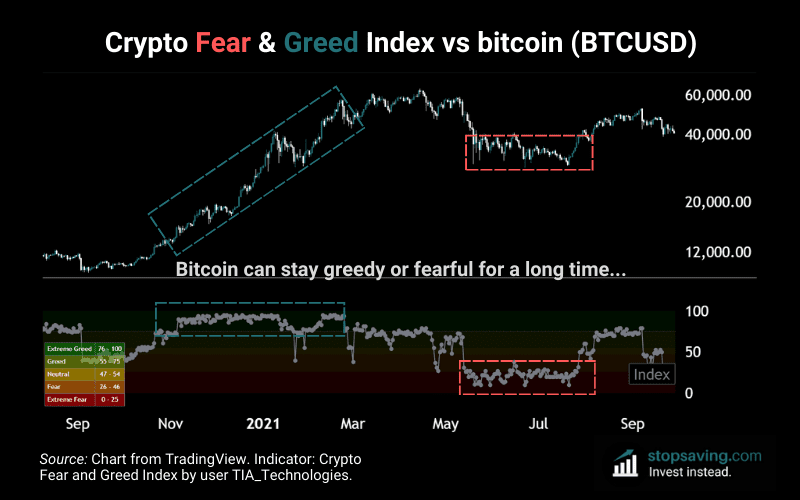
Warren Buffet famously said: “Be fearful when others are greedy, and greedy when others are fearful”. Ah, if only investing were that simple.
That said, the Fear and Greed index can still be useful for stocks and crypto. But as with all trading indicators, don’t follow it blindly – and combine it with fundamental and/or technical analysis for best results. After all, markets can stay fearful (or greedy) longer than you can stay solvent.
As usual, none of this is investment advice. If you liked this piece, check out my free newsletter for how-to guides and investment insights across crypto, stocks, metals, and more.
Key takeaways
- The Fear and Greed Index measures market sentiment and ranges from extreme fear (0) to extreme greed (100).
- Stocks and crypto each have their own Fear and Greed indicators, but both signal when markets might be overheated (greedy) or oversold (fearful).
- Use the index as a guide, not a rule. Combine it with other analysis to make better trading decisions.


