

What Is The DXY Index? A Guide For Traders & Investors

The US dollar is like a wrecking ball for the global economy. When it swings, it can smash through financial markets, trade, and even debt costs. The DXY Index (US Dollar Index) helps traders and investors track these movements – showing how the dollar stacks up against six major currencies. In this guide, you’ll learn what the DXY is, and why it matters for your investments.
AI-generated podcast version of this guide
Prefer to listen? Check out the AI-generated podcast version below for a conversational take on this guide.
What is the DXY Index?
The DXY measures the strength of the US dollar against a group of six other currencies. Think of it like a scoreboard for the dollar – if the DXY is rising, the dollar is getting stronger versus those currencies. If it’s falling, it’s the opposite.
The table below shows the percentage of each currency in the index:
| Currency | % of DXY Index |
|---|---|
| Euro (EUR) | 57.6% |
| Japanese Yen (JPY) | 13.6% |
| British Pound (GBP) | 11.9% |
| Canadian Dollar (CAD) | 9.1% |
| Swedish Krona (SEK) | 4.2% |
| Swiss Franc (CHF) | 3.6% |
The Intercontinental Exchange (ICE) keeps the DXY’s percentages in check, using a “weighted average” of the different exchange rates. As the table shows, the euro makes up more than half of the index (57.6%). In other words, the EUR/USD exchange rate (the cost of euros in dollars) is the DXY’s biggest contributor. So if the euro weakens against the dollar, the index is more likely to rise (or vice versa). And the smaller currencies – like the Swedish krona and Swiss franc – don’t move the needle as much.
How to chart the DXY Index in TradingView
You can easily chart the DXY Index in TradingView – just type “DXY” into the search bar, like so:

Now, the TradingView chart below shows the index. In this case, each red or green price candle represents one month of movement for the index. So, the chart gives you a zoomed-out view of the dollar’s growth versus the six currencies. The index has been in a steady uptrend since the 2008 financial crisis – i.e., the dollar has strengthened since then.

Side note: if you’d like a free tutorial on TradingView, download my PDF guide below.
Why the DXY matters for the global economy
Since the US dollar is the currency of the world’s biggest economy, the DXY can have a big impact on the global economy. The greenback is the go-to currency for international trade – and many countries and companies borrow in US dollars.
So when the dollar strengthens, repaying that debt gets more expensive. On the flip side, a weaker dollar gives borrowers some breathing room, which can help their economies recover faster.
To use an (over-simplified) analogy, the dollar is like the lifeblood of the world economy. When it flows freely (cheaper versus other currencies), the global economy tends to thrive. But when it slows down (becomes more expensive), the economy might struggle to keep up.
How the dollar affects stocks, bitcoin, and gold
A surging DXY doesn’t automatically mean markets will fall, but it can weigh down stocks, bitcoin, and gold.
Stocks: A rising dollar can hurt US stocks, especially companies that rely on exports. A stronger dollar makes their products more expensive overseas, which can hurt profits. The US dollar can also be a “flight to safety” when investors get nervous about the stock market. For example, the DXY rallied massively during the dotcom crash in the early 2000s, the 2008 financial crisis, and the 2022 bear market. You can see this in the teal boxes in the chart below:

Bitcoin: the crypto can struggle when the DXY is rising. The 2018 and 2022 bitcoin bear markets both happened when the US dollar was rising – and it was the same with the 2020 Covid crash (see the blue boxes in the chart). As with stocks, investors went “risk-off” in these times to the “safety” of the US dollar.
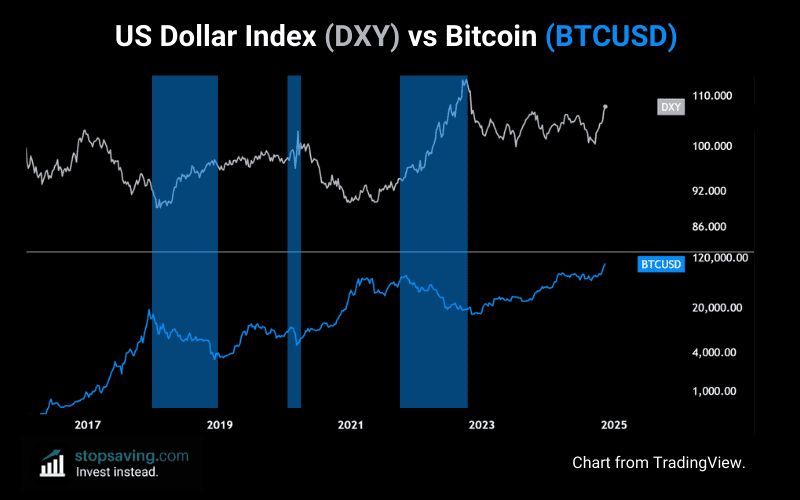
Of course, in the long run, bitcoin is a much better store of wealth than the dollar. And there have been times where bitcoin and the DXY climb at the same time.
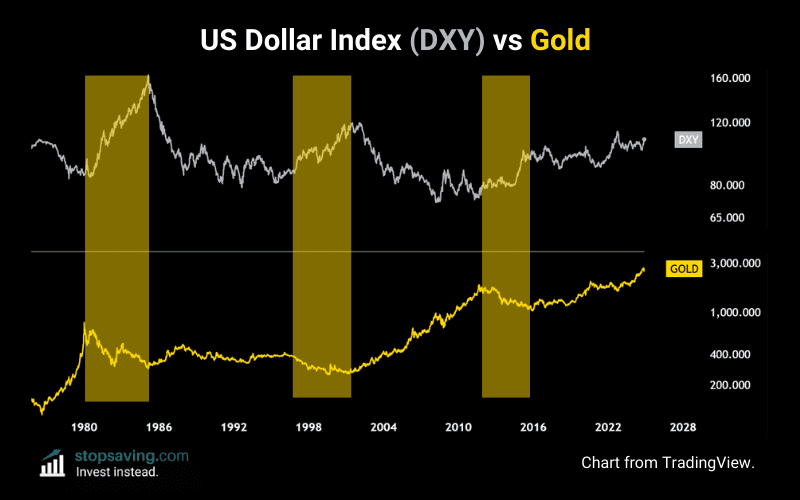
Gold: the yellow metal (like most commodities) is priced in US dollars. So when the DXY rises, gold gets expensive for other countries, which can lower demand and drag prices down. As with stocks and bitcoin, it’s not always an exact science – gold and the dollar can both rise together. But looking at the chart, gold’s biggest falls usually come with strong greenback rallies.
How to use the DXY in your trading or investment strategy
It’s usually best to “trade the chart in front of you.” So if you’re trading bitcoin, stick to the bitcoin chart. But if you want to get a sense of overall market sentiment, keep an eye on the DXY. When it moves wildly, it usually means something’s going on in the markets.
As usual, none of this is investment advice. If you liked this piece, check out my free newsletter for how-to guides and investment insights across crypto, stocks, metals, and more.

Key takeaways
- The DXY measures the US dollar’s strength against six currencies. The euro takes up the biggest chunk of them.
- The DXY impacts global trade, debt. A stronger dollar can slow global economic growth, while a weaker dollar can boost it.
- Stocks, bitcoin, and gold sometimes can have opposite relationships to the DXY. But not always.


