

Brent Crude Oil Hit Falling the Wedge Target – Now What?
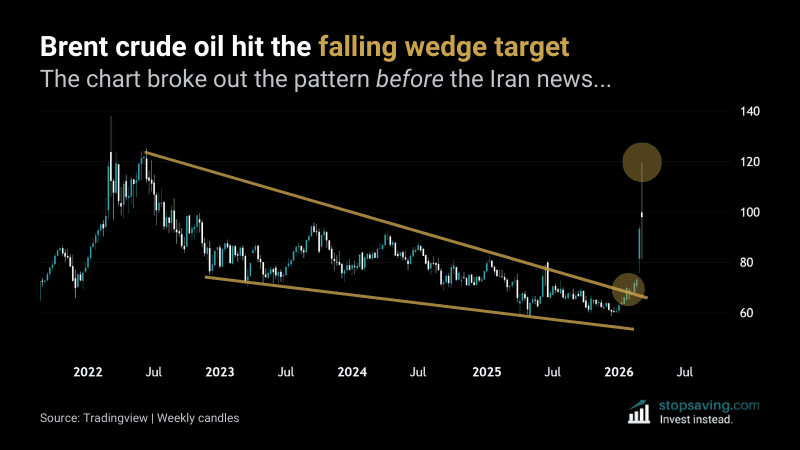
Two weeks ago, I wrote about Brent crude oil (UKOIL) breaking out of a multi-year falling wedge on the monthly chart. The pattern pointed to higher oil prices. Then on February 28, the US and Israel started bombing Iran. The oil price spiked, hitting the falling wedge target zone around $120 on March 9. Then it reversed back below $100.
This is an unfortunate example of Bernard Baruch’s famous quote: “Show me the chart and I will tell you the news”.
Show me the chart and I will tell you the news
Bernard Baruch famously shorted the US stock market right before the 1929 crash. He once said: “show me the chart and I will tell you the news.” The falling wedge breakout flagged a potential move higher before the Iran news hit. That’s how compression patterns work. When a market squeezes into a tighter trading range for years, the eventual breakout tends to be big.
Brent crude went from $71 on February 27 to nearly $120 on March 9. That’s roughly a 68% spike in less than two weeks.
Fundamentally and geopolitically, the oil spike made sense. US and Israeli forces struck Iran, and its oil infrastructure is now at risk. The Strait of Hormuz – where about 20% of the world’s oil passes through daily – is effectively closed to most traffic. Gulf producers like Iraq and Kuwait have started cutting output because they can’t ship through Hormuz. Less oil production makes oil scarcer and more expensive.
Oil hit the falling wedge target, so what’s next?
You calculate the falling wedge target by measuring the widest part of the pattern and adding it to the breakout point. Depending on how you draw the wedge, the target lands around the $120 area. Brent spiked to $119.50 and then reversed. Close enough.
That’s not a coincidence – smart money tends to take profits before the target, not at it.
The “easy move” from the pattern is done. Oil at $90-plus from a war isn’t the same as oil at $90-plus from organic demand.
If the Strait of Hormuz reopens, oil could lose more firepower. Right now the chart seems to be pointed that way…
As usual, none of this is investment advice. To learn more about falling wedges and other compression patterns, check out our Compression Patterns Explained guide.



