Tesla Bounces At The Golden Fibonacci (After Weak Earnings)

Tesla reported weak Q1 2025 earnings on Tuesday. But the stock price closed Wednesday over 5% higher – and the market is wondering why. This chart may hold the answer: Tesla bounced right off the 61.8% Fibonacci retracement – the so-called “golden ratio.” That level often acts as strong price support after big downward moves. That’s as good a reason as any for a bounce (despite the bad news).
How bad was Tesla’s latest earnings report?
Compared to this time last year – not great. Tesla’s business was way less profitable in Q1 2025 than in Q1 2024. The table below shows it:
| Metric | Q1 2024 value | Q1 2025 value | % change |
| Revenue | $21.3 billion | $19.3 billion | Down 9% |
| Earnings per share (EPS) | $0.41 | $0.12 | Down 71% |
| Net income | $1.39 billion | $409 million | Down 71% |
Despite the poor financials, there were some good things about the earnings call. For example, Musk said Tesla’s long-awaited cheaper model and full self-driving plans are still on track for this year. He also promised to spend more time at Tesla – a move that seemed to calm investors. Maybe that’s why the stock bounced too.
What’s next for Tesla’s stock price?
The chart below winds back the clock to 23 April last year, when Tesla reported its Q1 2024 earnings. The stock also bounced near the 61.80% Fibonacci back then (gold circle). And that turned out to be a phenomenal long-term buying opportunity.
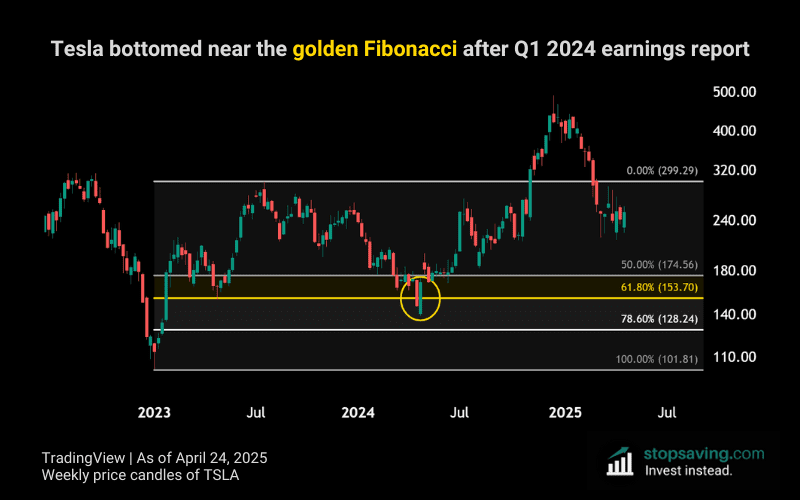
Just keep in mind that Tesla’s stock price was lower back then and the company was more profitable. So if you’re bullish on Tesla, you’ll want to see the golden Fibonacci retracement hold. If it doesn’t, the bounce might just be that – a bounce.
As usual, non of this is investment advice. For a full understanding of how trade using Fibonacci ratios, download our PDF guide below: