Sell in May vs Buy and Hold – What the Data Says
“Sell in May and go away” is one of the oldest seasonal strategies in investing. The idea is simple: sell stocks on the first trading day of May to avoid the summer chop. Then buy back in November, when big investors are back at their desks and year-end rallies often begin. But how has that strategy stacked up in the past? Here’s what the data says over the past 50, and 25 years.
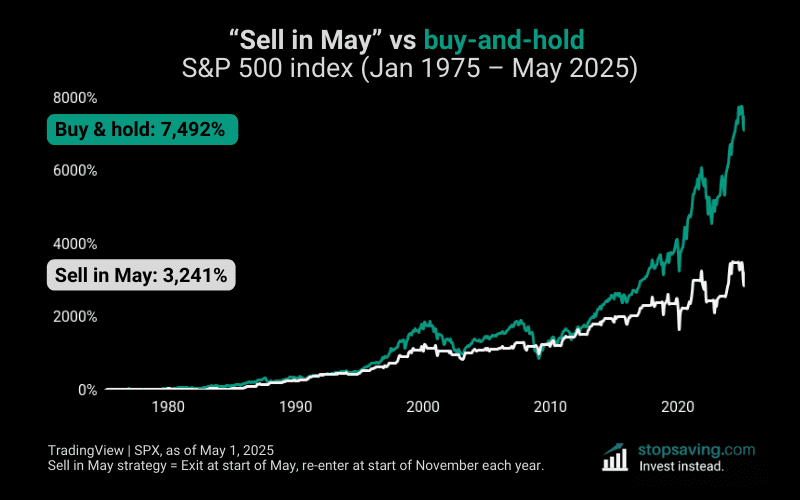
Sell in May vs buy and hold: 50-year chart
From January 1975 to May 2025, the S&P 500 index (green) grew 7,492%. That’s a compounded yearly return of 8.95%. Over 50 years, a $100 investment would have grown into $7,592.
The “Sell in May” strategy returned about half as much – 3,241% (gray) – turning $100 into $3,341. But here’s what’s interesting: the yearly return for Sell in May was only slightly lower, at 7.16%. That small difference shows just how powerful compounding becomes over time.
What about the past 25 years?
Zooming into the past 25 years (January 2000 to May 2025), the Sell in May strategy looks even weaker. Buy-and-hold returned 319% (4.69% per year), turning $100 into $419. Meanwhile, Sell in May returned just 118% – a yearly return of only 0.64%. You’d have barely doubled your money, ending up with just $218.
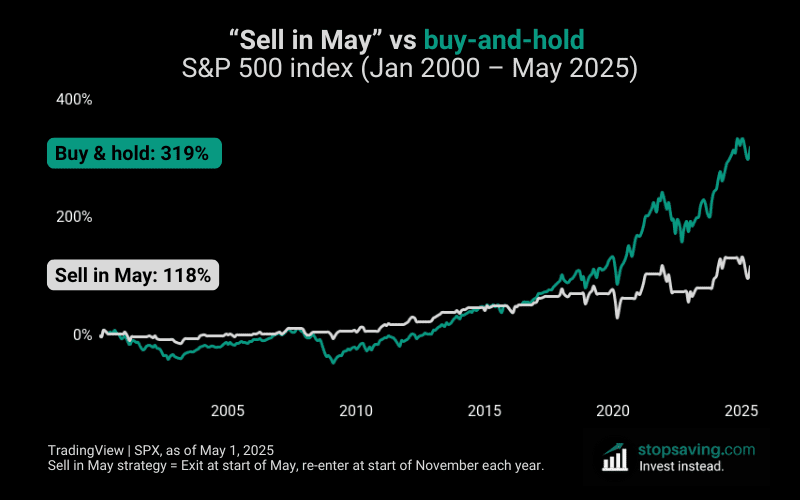
Looking at the chart, the Sell in May strategy would have kept you out of two major bear markets. You would have sold before most of the dotcom crash in the early 2000s, and the 2008 financial crash.
But you know what they say: time in the market beats timing the market. They also say that past performance is no guide to future results.
As usual, none of this is investment advice. If you liked this analysis, check out my free newsletter for how-to guides and investment insights across crypto, stocks, metals, and more.