

Bitcoin Closed January With An Indecision Doji (What It Means)
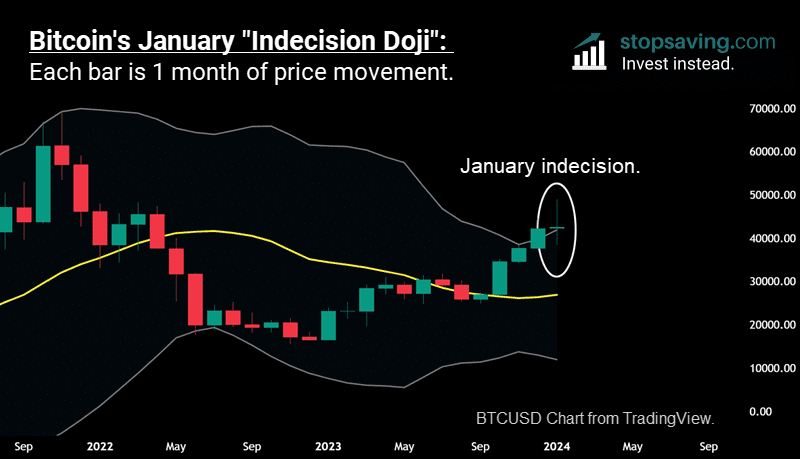
If you’d bought bitcoin at exactly the start of January, then sold it at exactly the end of January, you would’ve made just under 1% on your investment. But in that month, you would’ve been whipsawed around (a lot). On January 11th (Bitcoin ETF launch day), you were up around 15% for the month. Then on January 23rd, you were down about 9%. With all that volatility and no real decision in the end, bitcoin closed January with a “long-legged indecision doji” candle. In this post, I’ll explain what that is, and what it could mean for bitcoin over the next few months.
What’s an indecision doji candle?
As the name suggests, an indecision doji candle shows indecision among investors about the direction of the trend. The price finishes the trading period (day, week, month, etc) pretty much flat – despite bigger price swings during the period (the long legs). Think of it like a tug-o-war between buyers and sellers that ends in a draw.
Each red or green bar in the chart below is a monthly price candle for bitcoin. The solid body of each candle is the difference between where bitcoin started the month (the open) and where it ended it (the close). The legs on the top and bottom of each candle body represent the highest and lowest price bitcoin reached during the month.
As you can see, January’s monthly candle (circled) had really long legs on either side, with a small candle body in the middle. So here, bitcoin ended the month flat (small candle body), with wild price swings in between (the long legs).
What could January’s price action suggest about bitcoin’s next move?
On its own, last month’s indecision doji means the market is uncertain about bitcoin’s next move. But when you consider what bitcoin did before January, I’d probably give the edge to the bears here. Think about it this way: October, November, and December were all big up months for bitcoin. So if investors are now undecided, it means the trend could be running out of steam.
Here’s another thing to keep in mind. January’s indecision doji closed above the top Bollinger Band. Prices tend to oscillate between the top and bottom band most of the time. So here, you have investor indecision when the price is “unusually high” relative to the top Bollinger Band. It’s a bit like climbing most of the way up an extremely high mountain – then stopping to have second thoughts.
But if you go by the book, you technically want to see a down month after the indecision month to confirm that a down decision has been made. And if February turns out to be a green month, get your oxygen mask ready. Because in that case, bitcoin could be headed where the air is very thin.
Want to learn more about price candles?
If you want to learn more about other price candles (besides indecision dojis) and how you can use them in your trading strategy, check out our trading course below.

As usual, none of this is investment advice. It’s just my interpretation of a price chart. But if you’d like to get these interpretations in real time, just subscribe below.


