

Solana Market Cap vs SOL Price: A Lesson In Token Dilution
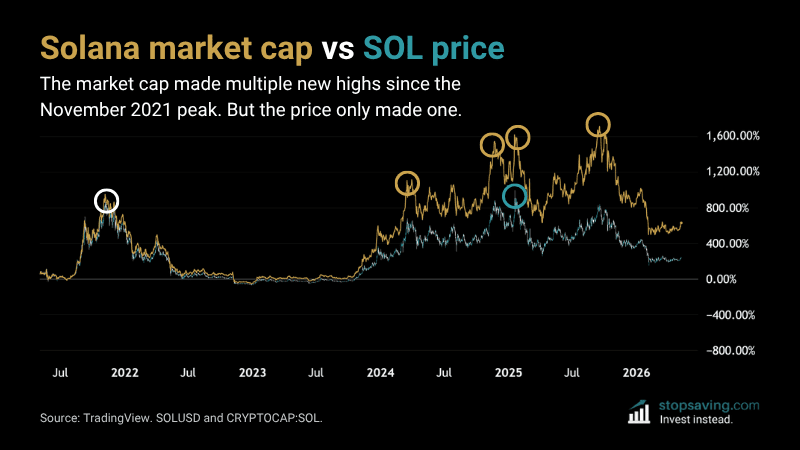
Solana’s market cap has made multiple new highs since the November 2021 bull market peak. But the Solana token price (SOL) has only made one – beating its 2021 high by about 14%. The reason is token dilution: Solana’s supply keeps growing, so each token owns a smaller slice of the pie.
Multiple new Solana market cap highs. Only one for SOL.
Market cap is the total value of all the SOL on the market. You get it by multiplying the SOL price by how many SOL are available to trade. When supply grows, the market cap can hit new highs even if the per-token price doesn’t.
SOL’s all-time high was $295.11 on 19 January 2025, per TradingView‘s SOLUSD index. The previous high was $260.05 on 6 November 2021 – nearly four years earlier. As the chart shows, Solana’s market cap made multiple new highs over the same period.
That’s the dilution math at work: more SOL exists today than in 2021. Every dollar of new buying has to spread across more tokens.
What this means if you hold SOL
You don’t buy the Solana market cap – you buy SOL tokens. So if the network mints new SOL faster than money flows in, your bag goes nowhere. The same applies to other altcoins with supply inflation.
But here’s some good news for SOL holders: Solana is set to mint less new SOL each year. Under the current schedule, the inflation rate falls 15% annually until it hits a floor of 1.5% by 2032. That’s a bit lower than bitcoin’s inflation rate was after the 2020 halving.The dilution drag on SOL’s price should get smaller. And its price and market cap should move more in sync over time.
But as with most inflationary altcoins, the real gains went to those who got there first.
As usual, none of this is investment advice. To learn more about how Solana works, check out our Solana Guide. If you liked this analysis, check out my free newsletter for how-to guides and investment insights across crypto, stocks, metals, and more.



