What is Bitcoin Dominance (BTC.D)? And How To Use It Right

If you trade or invest in crypto, you may have come across the term “bitcoin dominance”. In this guide, we’ll explain what bitcoin dominance is, how it works, and how to use it correctly in your crypto strategy.
What is bitcoin dominance?
As the name suggests, bitcoin dominance is a metric that measures how much bitcoin “dominates” the overall crypto market. The metric ranges between 0% (lowest possible BTC dominance) and 100% (highest).
When bitcoin dominance rises: bitcoin’s market cap (price times coin supply) is increasing relative to the market cap of other cryptos. In other words, bitcoin is gaining market share (and value) versus most altcoins. So here, investors would generally be better off owning bitcoin than higher risk altcoins.
Keep in mind, the bitcoin price can still drop while the dominance is rising. In that case, bitcoin is just dropping by less than altcoins. Bitcoin dominance tends to climb in crypto bear markets – as investors sell riskier altcoins for relatively safer bitcoin. It can also rise in bitcoin bull markets, though, when bitcoin is rallying harder than altcoins.
When the big dog (bitcoin) is in the yard, the cats (altcoins) tend to stay on the fence – watching, waiting, and often underperforming.

When bitcoin dominance drops: bitcoin is getting weaker versus the broader altcoin market. In the past, crypto’s major “altseasons” have happened when the dominance drops sharply. That’s when altcoin prices tend to go vertical, and making money in crypto is “easy”.
But as the chart below shows, altseasons typically don’t last long, so investors need to make hay while the sun shines.

How to open the bitcoin dominance chart (BTC.D) in TradingView
You can open the bitcoin dominance chart in TradingView – the ticker is BTC.D (long name: Market Cap BTC Dominance, %). The screenshot below shows the steps involved.

Side note: if you’d like to learn how to use TradingView, download this free TradingView PDF tutorial below:
How to use the bitcoin dominance chart (BTC.D) in your strategy
The bitcoin dominance chart is a useful tool for gauging general crypto sentiment. At a glance, it helps you see whether bitcoin or the altcoin market is relatively stronger.
The table below summarizes how BTC.D and bitcoin’s price typically affect altcoins. These relationships aren’t guaranteed, but they can provide insight into the broader altcoin market sentiment.
| BTC.D | Bitcoin Price | Altcoin Prices (in USD) |
| Rising | Rising | Dropping, or rising less than bitcoin |
| Rising | Dropping | Dropping more than bitcoin |
| Stable | Falling | Dropping |
| Falling | Rising | Rising more than bitcoin |
| Falling | Stable | Stable, or dropping less than bitcoin |
| Stable | Rising | Rising |
You can also use technical analysis on the BTC.D chart to better understand its trend. But remember: not all altcoins are created equal. So usually, you’re better off charting your specific altcoin versus bitcoin.
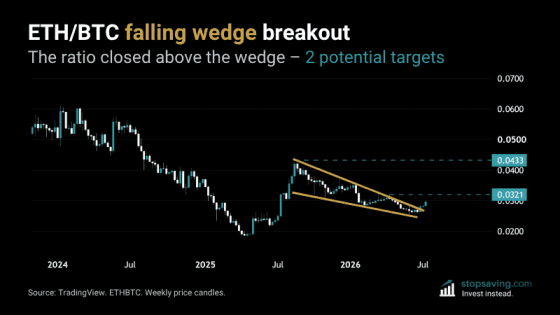
For example, you could chart SOLBTC in TradingView to track Solana versus bitcoin, or ETHBTC to track Ethereum. This way, you’re trading the chart in front of you — without all the market noise.

Key takeaways
- Bitcoin dominance (BTC.D) measures bitcoin’s share of the total crypto market. When it rises, bitcoin is typically outperforming most altcoins.
- BTC.D can trend higher in bear markets as investors sell riskier altcoins for safer bitcoin. It can also rise in bull markets when bitcoin leads the rally.
- The BTC.D chart in TradingView is useful for tracking market sentiment. But it’s even better to chart individual altcoins against bitcoin for a clearer picture.
As usual, none of this is investment advice. If you liked this piece, check out my free newsletter for how-to guides and investment insights across crypto, stocks, metals, and more.