

Has MicroStrategy’s 200-Week MA Flipped Bullish?
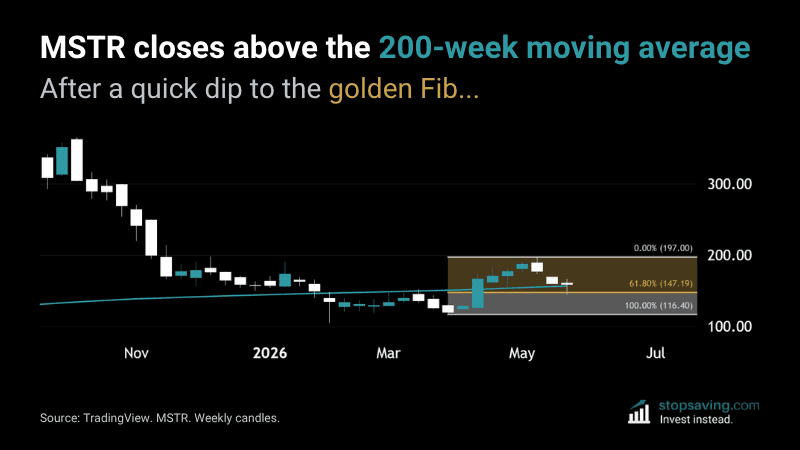
MicroStrategy stock (aka Strategy, MSTR) did something interesting last week: it held the 200-week moving average as price support. After bouncing at the 61.8% “golden” Fibonacci ratio on Thursday, the stock closed Friday above the moving average.
Old resistance morphed into new support?
Back in March, the 200-week moving average was resistance for MSTR. The price tried to close above it but got rejected back down to $116.40. Then in April it ripped straight through it, rallying all the way to $197.00 in May.
After that short-term peak, the stock started falling again. But the 61.8% “golden” Fibonacci ratio saved it. That’s the level where the price had given back 61.8% of its April-to-May rally. It bounced there on Thursday, then closed Friday back above the 200-week moving average.
When a price breaks above old resistance and the level then holds as support, that’s a support resistance flip.
As far as I’m concerned, that’s bullish – so long as the support still holds on weekly close. If you believe in Michael Saylor’s long-term bitcoin strategy, this could be a buying opportunity.
As usual, none of this is investment advice. To learn how to trade using moving averages, check out our Moving Averages Explained guide.



