

Gold Tests Its 200-Day Moving Average (Again)
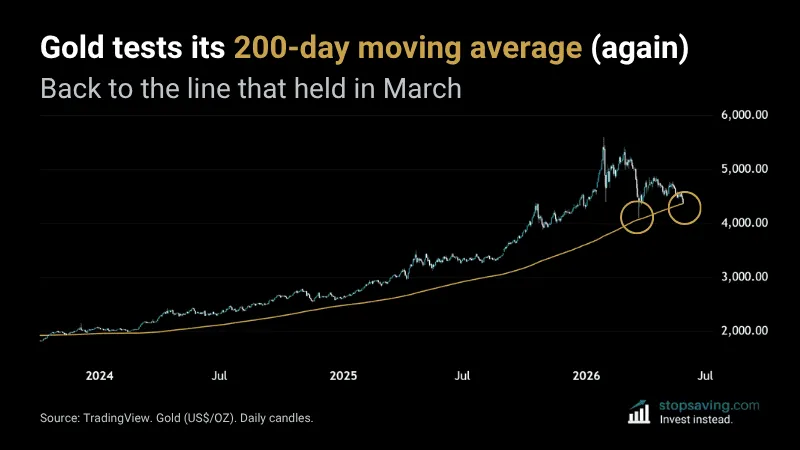
About a month ago, I wrote about three bearish signals for gold. The price has fallen since then. Gold is now trading back at its 200-day moving average – the same line it bounced off hard in March.
Gold’s 200-day moving average in March
On March 23, gold dropped to $4,098.74 per ounce – right around its 200-day moving average (gold line). That drop to the 200-day MA was fast and violent. As was the bounce off it.
The 200-day moving average tracks the average closing price of gold over the past 200 days.
This time gold looks tired
The difference this time is how gold got here. In March, it dropped fast and snapped back in a day. Now it has bled lower for weeks, making lower highs since the rally died at the 50% Fibonacci level.
Trader folklore says a fast drop into support tends to bounce, while a slow grind into it tends to break. It also says the more times you test support, the more likely it is to break.
Gold’s 200-day MA is still rising – it’s long term trend is still up by that measure. But gold hasn’t closed a daily candle below this line since the run from $2,000 began over two years ago.
So gold bugs will want to see it hold here.
As usual, none of this is investment advice. I can be wrong, just like everyone else. To learn more about moving averages, check out our Moving Averages Explained guide.



