ETHBTC Analysis: Ascending Triangle & ETF Deadline Breakout?
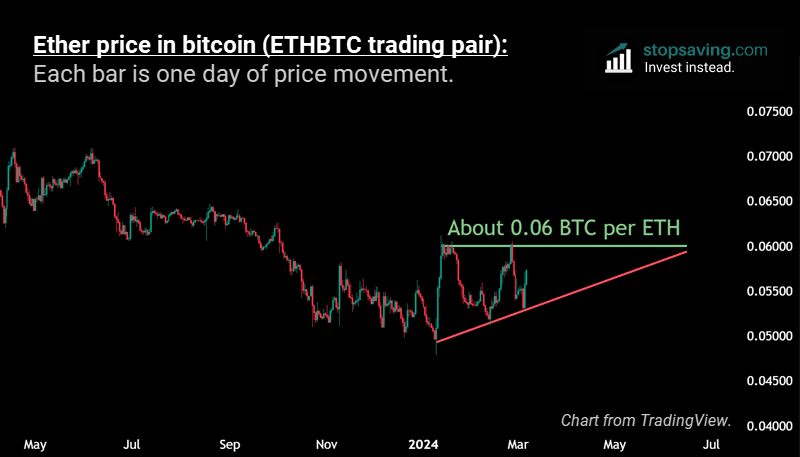
If you’re pondering whether Ethereum or Bitcoin will do better this year, take a look at this chart. It shows a potential ascending triangle forming for ether priced in bitcoin (aka the ETHBTC trading pair). If it breaks to the upside, you could expect ether (ETH) to outperform bitcoin (BTC) for a while.
Each bar in the chart represents one day of price movement for ETHBTC. Notice how the red line at the bottom connects the lows, and the green line at the top connects the highs. If we extrapolate this out into the future, we get an ascending triangle shape. The triangle would have an apex somewhere in late June of this year.
Ascending triangles explained:
Ascending triangles are usually bullish trading patterns. Think of it like this: the green line at the top acts like a temporary ceiling on the price (aka the resistance). When buyers push the price up to that ceiling, sellers push it back down – but with less strength each time. Buyers then step in at higher levels as the price forms higher lows. Connecting those lows gives us the bottom part of the triangle (the red line sloping up).
More often than not, ascending triangles tend to break above the resistance. The logic here is that sellers eventually get tired of defending the price ceiling, giving buyers the power to push the price through it. Watch this quick video below from our technical analysis course to learn how to trade ascending triangle patterns:
The bigger picture (with some speculation on when this ETHBTC ascending triangle breaks out):
I mentioned that the apex of the ETHBTC ascending triangle would be somewhere in late June of this year. But statistically, these patterns often break out about 75% of the way through. That would put us somewhere in late May. This also happens to be around the May 23rd deadline for the US Securities and Exchange Commission (SEC) to approve or reject VanEck’s spot Ethereum ETF application. Interesting.