

S&P 500: 3 Closes Below the Lower Bollinger Band
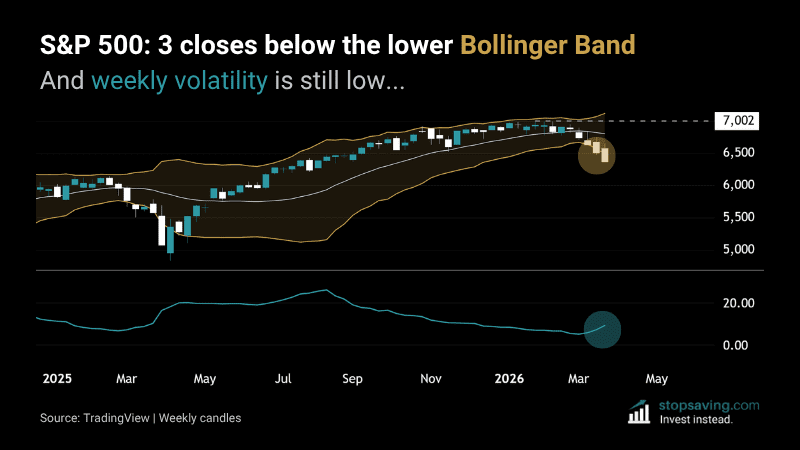
The S&P 500 (SPX) topped at 7,002 points on 28 January 2026. It started dropping slowly at first (as many tops do), then faster. Three consecutive weekly candles have now closed below the lower Bollinger Band, which suggests downward volatility is picking up. And here’s the scary part: volatility is still low, according to the indicator.
What do the Bollinger Bands say about the S&P 500?
Bollinger Bands expand when volatility rises and contract when it falls. The outer bands are two standard deviations above and below the middle band – also the 20-week moving average. That’s a fancy way of saying: the further the price moves away from its average, the wider the bands get. So when the price closes below the lower band, sellers are pushing it beyond its normal downside range.
But three consecutive weekly closes below the lower band is a different beast. It tells you sellers aren’t just pushing the price lower – they’re doing it with sustained force. Each close below the band stretches it wider, meaning volatility increases as the price drops.
Meanwhile, the Bollinger Band Width indicator (green in the chart) still has a relatively low reading. As the name suggests, it measures the width of the Bollinger Bands. In other words, the S&P 500’s volatility – at least based on weekly price changes – is still low.
The market isn’t in full panic mode yet.
Don’t try to catch a falling knife that could fall faster
So long as the S&P 500 keeps closing weekly candles near the bottom Bollinger Band, turning bullish is a stretch.
Instead of trying to catch a falling knife, you could wait for it to slow down. That would involve the S&P 500 reclaiming the lower Bollinger Band.
That’s the first step.
As usual, none of this is investment advice. To learn more about Bollinger Bands, check out our Bollinger Bands Explained guide.



