

Bitcoin (BTC) vs Downward Trendline
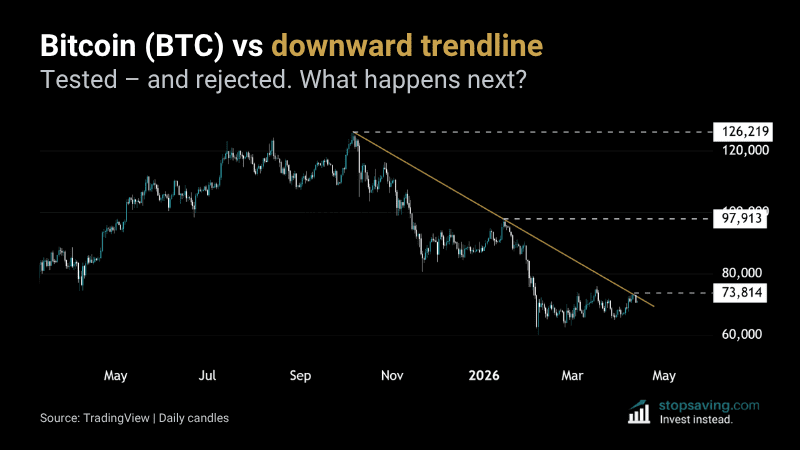
Bitcoin peaked at $126,000 on 6 October 2025. It then made a series of lower highs – and a downward trendline connects them. The second lower high came in around $98,000 in January. The price then crashed to around $60,000 in early February. It’s bounced since – but last week it ran into the trendline and got turned away. Now what?
What the downward trendline means
A downward trendline connects lower highs. It’s like a descending ceiling: each time bitcoin tries to rally, sellers push it back down at a lower level.
Bitcoin’s trendline now has three clean touches, with last week’s rejection at around $73,000. The more times a trendline gets tested without breaking, the more investors pay attention to it.
A daily close above the trendline would now be a big deal – as it would signal a change in investor behaviour. Bitcoin would still be in a downtrend (with lower highs and lower lows), just not as strong a downtrend.
That could be the turning point before the next uptrend.
Iran is now charging oil tankers bitcoin tolls to pass through the Strait of Hormuz – $1 per barrel, paid in BTC. Shipping companies are being forced to hold bitcoin just to move oil. The news briefly pushed the price toward $73,000.
But coerced demand from a war zone isn’t the same as organic buying. It’s usually best to trade the chart, not the news.
As usual, none of this is investment advice. To learn more about how to use trendlines in your strategy, check out our Trendlines Explained guide.



