Bitcoin Volatility At Extreme Lows – Big Move Brewing?

Bitcoin volatility has collapsed to extreme lows. History says that won’t last forever – and bitcoin could be gearing up for a big move. According to the Bollinger Band Width Percentile (BBWP) indicator, bitcoin’s day-to-day price swings are now at their lowest levels since July 2020.
How does BBWP track bitcoin volatility?
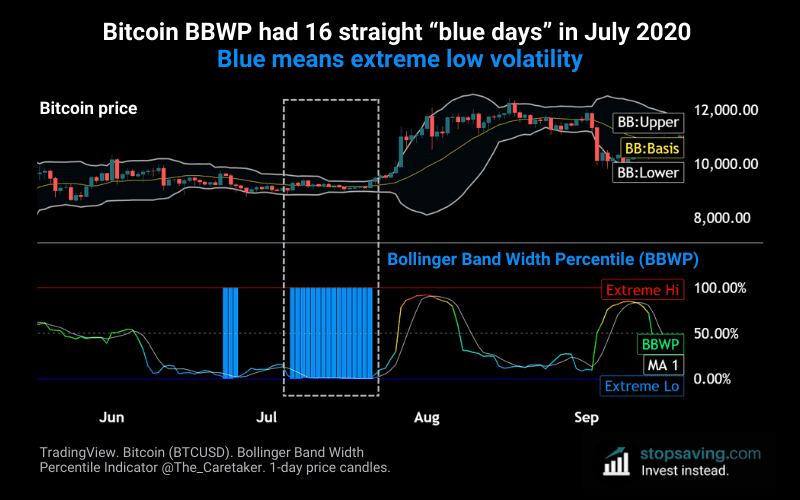
The chart below shows the bitcoin price (top) and BBWP (bottom). At the top, you’ll notice Bollinger Bands around bitcoin’s price. The outer bands measure day-to-day volatility based on how far bitcoin’s price deviates from its 20-day moving average (middle band). The narrower the bands, the lower bitcoin’s volatility.
BBWP (credit to Eric Krown) measures the width of those bands, then compares it to the average width over the past 252 days. That gives a relative volatility score between 0% (dead quiet) and 100% (full-blown chaos). In short, BBWP tracks how calm or explosive bitcoin is compared to its last 252 days.
Right now, the blue bars – showing extreme low volatility – have been flashing for eight straight days. That hasn’t happened since July 2020, when bitcoin had 16 blue days in a row (chart below).
What does this mean for the bitcoin price?
Benjamin Franklin once said: “Nothing is certain except death and taxes.” I’d add bitcoin volatility returning to that list. All markets move in cycles – quiet periods lead to wild ones (and vice versa). Bitcoin just does it on a whole other level.
Sure, volatility could stay low for a while longer. But at some point, the bands will expand. And typically, the lower the volatility before the expansion, the bigger the price move when it happens.
But here’s what’s less certain: the direction of that move. Volatility itself is direction-neutral – it says nothing about whether bitcoin will go up or down.
As usual, none of this is investment advice. If you liked this piece, check out my free newsletter for how-to guides and investment insights across crypto, stocks, metals, and more.