

MicroStrategy Volatility – Back From Bollinger Band Squeeze
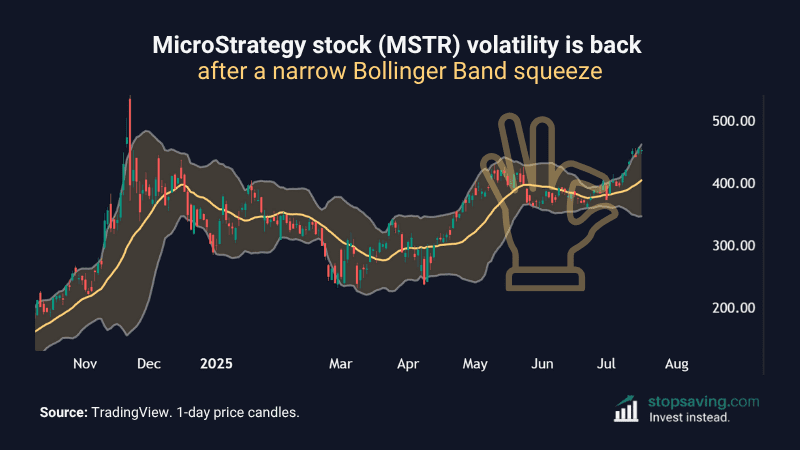
With bitcoin breaking out to new highs lately, MicroStrategy stock (MSTR) is waking up again. This chart shows the daily price candles of MSTR, and the Bollinger Bands surrounding it. In late June, the bands squeezed together tightly – meaning volatility dropped off. But now that the bands are getting wider, volatility is back with a vengeance.
Why this Bollinger Band squeeze is interesting
The narrower the bands pinch together, the lower the volatility of MicroStrategy stock. The chart below shows the Bollinger Band Width indicator in blue. Lower readings mean narrower Bollinger Bands (so lower volatility). And typically, lower readings lead to bigger moves when volatility returns as the bands expand.
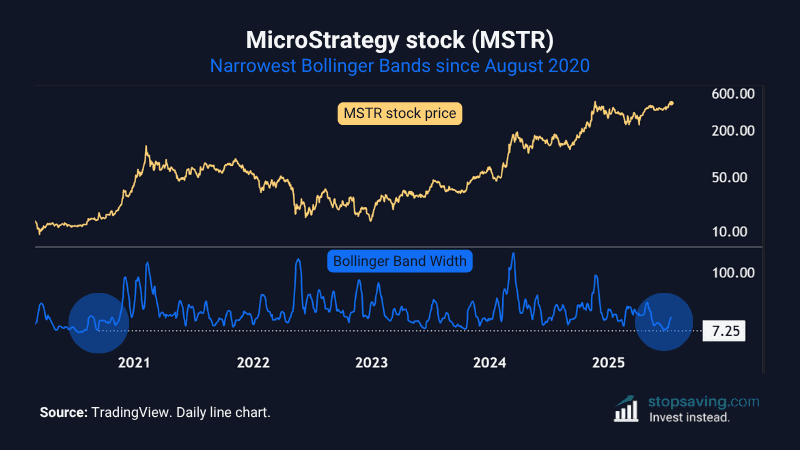
The indicator just clocked a reading of 7.25 in June this year – it’s lowest since September 2020. Interestingly, MicroStrategy bought its first bitcoin in August 2020, before its stock price went on a massive run. You read this guide to learn how MicroStrategy’s bitcoin strategy works.
So what could be next for the price of MSTR?
Volatility is “direction-neutral” – it can make a stock go up or down. So far, MSTR’s volatility is making its price go higher. The price is riding the top Bollinger Band, which is usually a sign of a powerful upward move. So long as the price keeps closing daily candles around that top band, the bulls have all the power. It’s only when the price closes below the middle band (20-day moving average), they might run out of steam.
As usual, none of this is investment advice. To learn more about Bollinger Band investing, grab our free PDF guide below:



