

How To Trade Ethereum In Q4 2024 (3 Simple Trendlines)
Wondering how to trade Ethereum in the fourth quarter of 2024? Here’s one approach, using three simple trendlines to manage risk.
YouTube video version of this article
Ethereum’s three key trendlines
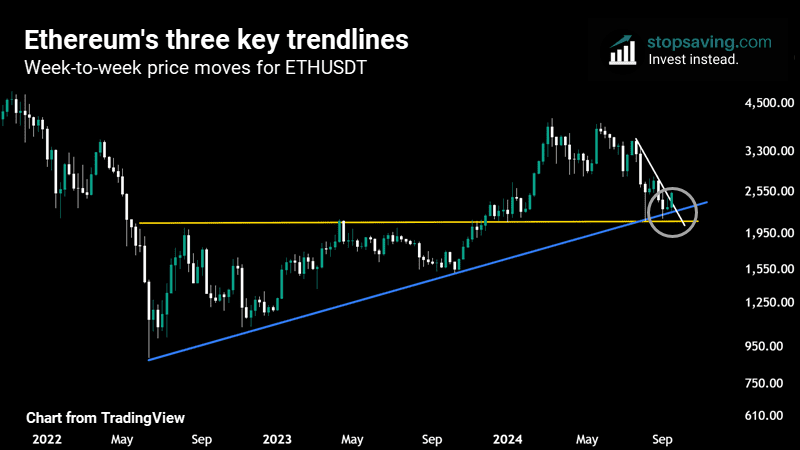
The chart below shows the week-to-week price moves of ETH (ether). I’ve set this chart to logarithmic scale in TradingView. That’s a fancy way of saying the chart focuses on percentage gains rather than number gains. And for that reason, logarithmic charts typically work better for longer term trendlines.
The blue trendline has sloped upward since June 2022, when ETH bottomed just below $900 in the last “real” crypto bear market. Since then, the trendline has acted as solid diagonal support for the ETH price—i.e., buying close to it would have been a profitable move in hindsight.
Ethereum’s token just hit that trendline again recently: once in August (quickly) and another time in September (which took a while longer). So long as it stays above that trendline (as in, it doesn’t end a week below it), ETH looks good to me. And any quick moves down toward it could be dip buying opportunities.
The gold trendline is a horizontal line of support—sitting at around the $2,100 mark. This is Ethereum’s final line in the sand. Lose that level and this whole Ethereum trade setup falls apart in my opinion. And at that point, it’s probably best to get out.
Finally, there’s the white trendline. Notice how ETH has broken this downward sloping trendline already. And that could mean that ETH’s summer downtrend is over. So long as it stays above it, of course.
Ethereum Fibonacci levels to watch
I drew a Fibonacci retracement from Ethereum’s recent peak on March 11, 2024 ($4,094 on my chart) to its low on August 5, 2024 (I get $2,110). The ETH price has already cleared its 0.236 Fibonacci retracement level at $2,467. In other words, ETH has already recovered more than 23.6 percent of that drop from March to August. The next key Fibonacci levels are all laid out in the chart. And you’ll want to pay close attention to them (see our Fibonacci guide here to learn why).
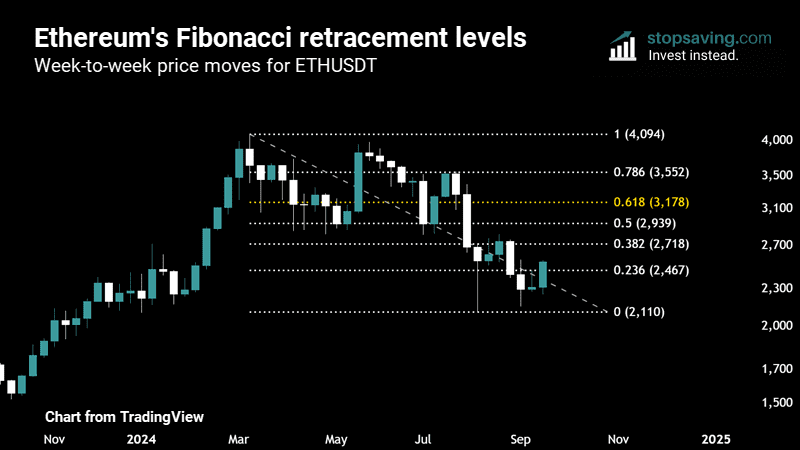
The “golden 0.618 Fibonacci ratio” tends to be a big profit taking area for traders—that would be a 61.8% recovery of the drop. For ETH, the golden Fib is at $3,178 (gold). But let’s not get ahead of ourselves just yet: it still has the 0.382 Fib level ($2,718) and 0.5 Fib level ($2,939) to conquer first.
The unlikely moment when Ethereum’s sentiment turned
This week I saw a video of Vitalik Buterin, Ethereum’s Co-Founder, singing on stage at the Token 2049 crypto conference in Singapore. He was singing about crypto encryption and a new form of wealth beginning. Tyler Durden from Zero Hedge posted the video on Twitter (X), saying “guys I think Ethereum might actually be going to zero”. If you watched the video (below), you may have had similar concerns yourself.
Guys I think Ethereum might actually be going to zero. pic.twitter.com/MC4ExtpPAx
— Tyler (@TylerDurden) September 18, 2024
But, hey, the crypto market works in mysterious ways. As Daan Crypto Trades pointed out on X, Vitalik’s musical performance might’ve been the pivotal event that turned Ethereum bullish again. Even though most of the market thought it was bearish.
Morale of the story? Never write off a man that sings about math and encryption on stage.
Idk guys, think most of you interpreted this pivotal event the wrong way around by saying it was bearish for $ETH. pic.twitter.com/LdOG9fyS5l
— Daan Crypto Trades (@DaanCrypto) September 19, 2024
As usual, none of this is investment advice. But if you liked this piece, check out my free newsletter for how-to guides and investment insights across crypto, stocks, metals, and more.
And check out this free guide to learn more about using trendlines in trading and investing.


