

Silver Dead Cat Bounce Into the Golden Fibonacci Pocket?
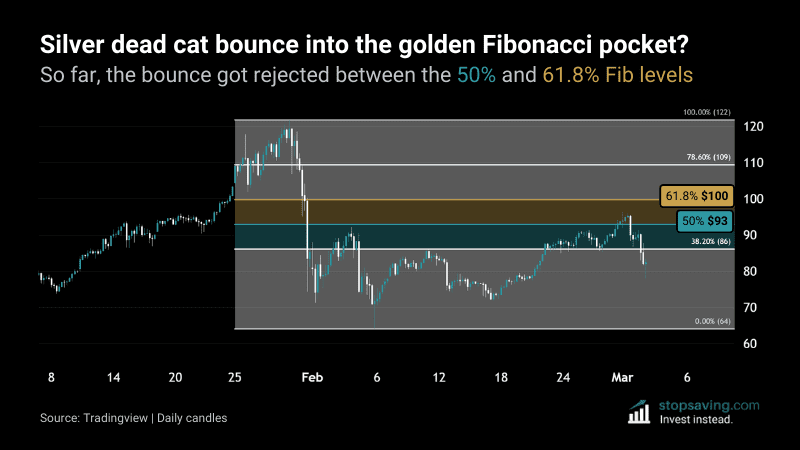
Silver rallied bigtime off its lows near $64 and pushed into the high $90s. But the daily chart shows the rally just hit a brick wall of sellers – right inside the golden Fibonacci pocket. That’s the zone between the 50% and 61.8% retracement levels. So far, it’s looking like a dead cat bounce for the No.2 metal.
How the Fibonacci pocket works (with the math)
To plot these levels, you take silver’s recent high ($122) and its low ($64). The total drop was $58. From there, each Fibonacci level measures how much of that $58 drop the price recovered.
38.2% Fib: $64 + ($58 × 0.382) = $86. Silver broke above this one.
50% Fib: $64 + ($58 × 0.50) = $93. The price pushed above it briefly.
61.8% Fib: $64 + ($58 × 0.618) = $100. Silver never reached it.
The zone between $93 and $100 is what traders call the “golden Fibonacci pocket”. It’s where profit-taking orders tend to stack up – and where resistance often shows up. The 61.8% level gets the name “golden ratio” because it comes directly from the Fibonacci sequence. And the pocket between 50% and 61.8% is the area where failed recoveries often tend to die.
On this chart, silver rallied into the golden pocket and got rejected somewhere in the middle. The daily candles show sellers stepping at in around $96 and pushing the price back down.
So far, this looks like a silver dead cat bounce
Silver is already trading back below the 38.2% Fib at $86. That means the rally into the pocket failed – and sellers didn’t just reject it, they chased it back down. When a price can’t hold the next Fib level after getting rejected at the golden pocket, it’s not a good look.
As the saying goes, if you drop a dead cat from high enough, even it will bounce. And silver dropped from way up high.
Dip buying only works until it doesn’t.
As usual, none of this is investment advice. To learn more about Fibonacci levels, check out our Fibonacci Trading Explained guide.



