

Bitcoin Just Tagged the 200-Week Moving Average “Value Zone”
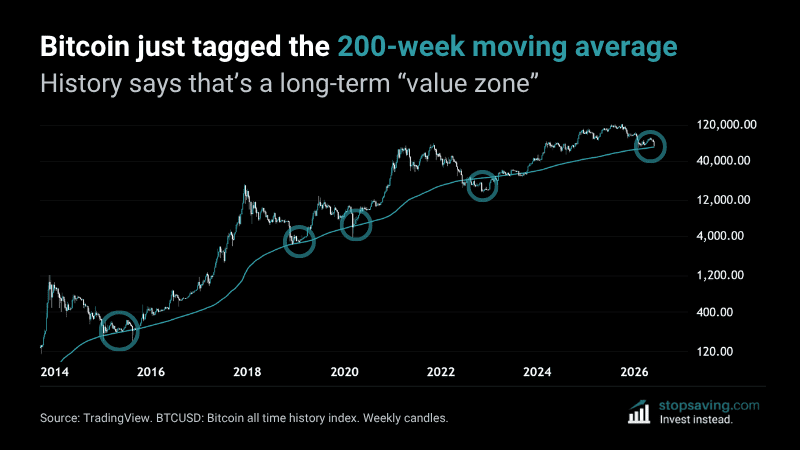
Bitcoin just tagged its 200-week moving average – a line with a serious track record. It’s been “close enough” to every major bitcoin bottom since 2015. In hindsight, each touch was a long-term value zone for bitcoin buyers to dollar-cost average in.
Why history calls the 200-week moving average a value zone
Look at the circles on the chart. Bitcoin touched this line in 2015, late 2018, the 2020 crash, and the 2022 bottom. Every time, it was near the low of the cycle.
The 200-week moving average shows bitcoin’s average price over the last 200 weeks (almost four years). Because it tracks such a long time frame, it moves very slowly – to focus on bitcoin’s long-term trend.
Back in January, I wrote about a bearish moving-average cross that pointed bitcoin toward the 200-week MA. Today bitcoin tagged the line for the first time since the last bear market bottomed. As the chart below shows, it never quite got there during the February low earlier this year.
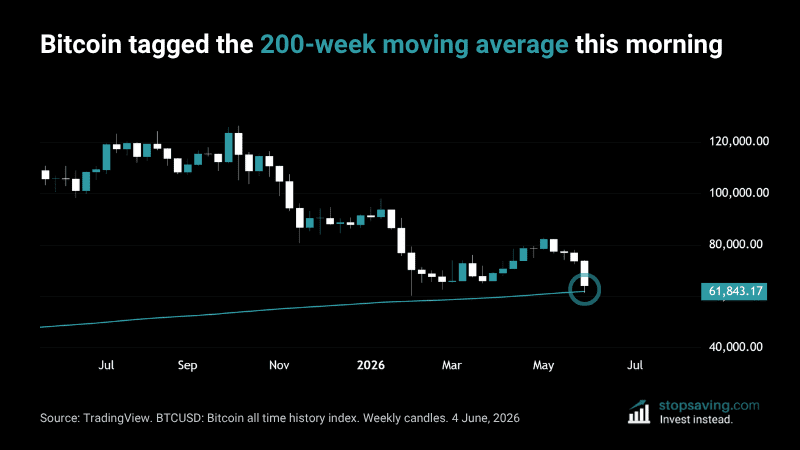
In the past, buying bitcoin near the 200-week moving average has worked out well for long-term investors. Of course, the 200-week moving average doesn’t have to hold this time – it can easily go lower. In 2022, it stayed below the line for about a year in total.
That’s why dollar-cost averaging might be better than going all in.
As usual, none of this is investment advice. To learn how to use moving averages in your investment strategy, check out our moving averages guide.



