

The Bitcoin Pullback Could Be Over (For Now)

The past two weeks haven’t been great for bitcoin. Its price dropped by about 10% from a high of just under $45,000 a coin to a low of just above $40,000. But Monday’s price action suggests that the bitcoin pullback could be over for now. And the bullish uptrend is more likely to continue than not.
Bitcoin has reclaimed its 20-day simple moving average
This chart plots the daily price candles of bitcoin (red and green bars) against the 20-day simple moving average (SMA, yellow line). The 20-day SMA is bitcoin’s average price over the past 20 days. This means it updates slower than the actual price of bitcoin to show the general trend minus the short-term noise. You’ll notice that the 20-day SMA line has sloped upward and held up bitcoin’s price (white circles) since the latest rally started in September. On Monday, bitcoin briefly pierced below it (blue circle), but reclaimed it by the end of the day.
Monday’s green candle was also a “bullish engulfing candle”. Here, the price wicked below Sunday’s low during the day – getting to about $40,500 per coin. But just when it looked like sellers would take control, buyers came back in force. And the price ended Monday near $42,600 – well above Sunday’s top.
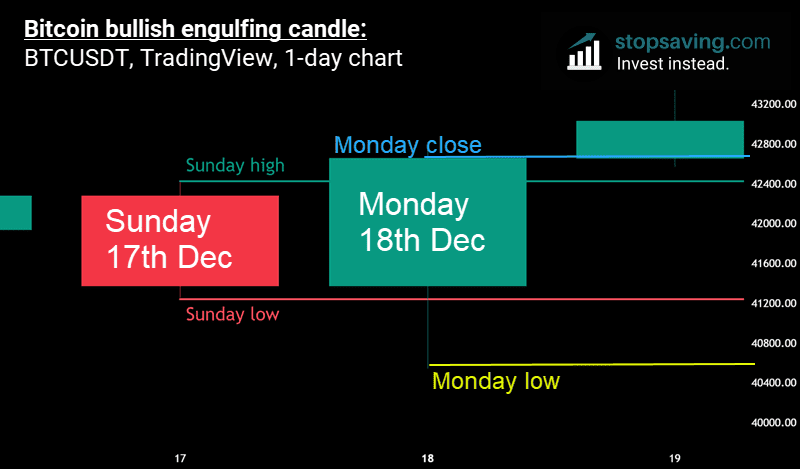
For the Bulls, this would be like scoring a try in rugby from the opposition’s scrum in their own half. The odds were stacked against them, but they won the passage of play and demoralized their opponents (the Bears) in the process.
And now the game is more in their favor – at least until the 20-day SMA finally gives way. At that point, we’ll probably see a real bitcoin pullback.
Disclaimer: none of this is investment advice. It’s just my interpretation of a price chart. If you like these quick updates, subscribe to our free newsletter for how-to guides and investment ideas across crypto, stocks, metals, and more.


