Silver Nears Key Resistance at the Golden Fibonacci (61.8%)

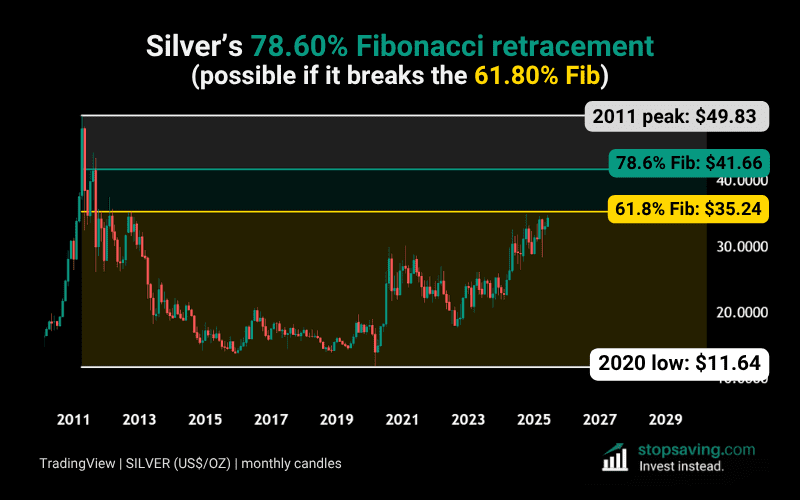
Silver’s climbed about 200% since its Covid crash low in 2020 – and it’s now approaching a major technical resistance level. This chart shows the 61.8% “golden” Fibonacci level at $35.24 per ounce. If silver gets there, that’s a 61.8% recovery of the drop from its 2011 peak ($49.83) to its 2020 low ($11.64).
Most technical traders will be watching this level to gauge what silver does next.
What’s driven silver’s rally so far?
Silver’s rally started in 2020 when central banks pumped trillions into the economy during lockdowns. That extra liquidity pushed investors into all kinds of assets – stocks, crypto, and even precious metals.
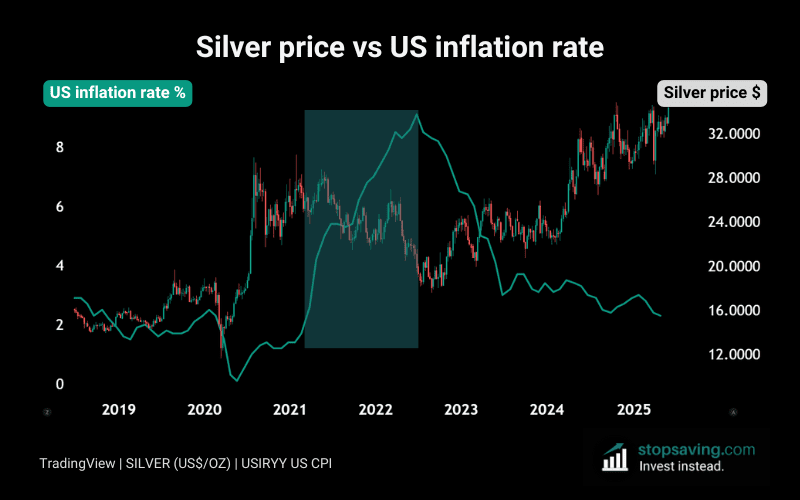
But all that money also flowed into everyday living expenses – and then inflation started rising, too. You can see the relationship between US inflation (green line) and the price of silver in the chart below. When inflation spiked (green box), silver took a big hit (just like stocks and crypto). But since inflation peaked in mid-2022, silver’s been back on the up.
There’s also a fundamental driver behind silver’s run. Silver is an industrial metal, with demand rising from things like solar panels, electric vehicles, and electronics. It’s a key player in the clean energy transition, and investors are starting to catch on.
Silver also tends to follow gold when it rallies – and gold has recently rallied to new highs. The gold to silver ratio has risen a bit this year, though, meaning gold has slightly outperformed.
So what’s next for the price of silver?
A clean break above the $35.24 level could open the door to a bigger rally – perhaps to the 78.6% Fib level at $41.66.
But until silver actually clears the 61.8% hurdle, the old trading wisdom might apply: don’t buy at Fibonacci resistance. Grab our free Fibonacci PDF guide below to learn why:
As usual, none of this is investment advice. If you liked this analysis, check out my free newsletter for how-to guides and investment insights across crypto, stocks, metals, and more.