

Bitcoin Trend: One Log Trendline To Track The Bull Run

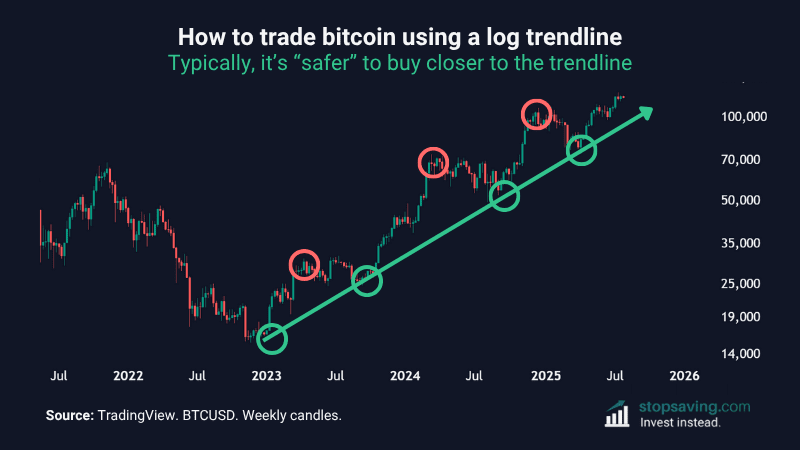
If you’re trying to track the bitcoin trend, the green trendline in this chart can help. Bitcoin has bounced off it many times during the current bull run, which began in 2023. As long as the trendline holds, it’s difficult to call for any sort of “bitcoin top” this cycle. That said, the trendline will break at some point, which could be where things turn more bearish for bitcoin.
A “logarithmic” trendline to track the bitcoin trend
You’ll notice on the vertical Y-axis in the above chart that the numbers (bitcoin prices) rise in bigger increments each time. At the bottom of the Y-axis, $14,000 steps up $19,000 (a $5,000 rise). But by the time we get to the top of the Y-axis, $70,000 jumps to $100,000 (a $30,000 rise).
That’s because this chart uses “logarithmic scale” in TradingView. Put simply, it means the numbers on the Y-axis measure the percentage changes in the bitcoin price. That’s different from “regular scale”, where the numbers go up in equal increments. In that case, the trendline wouldn’t fit at all (see the regular scale chart below):
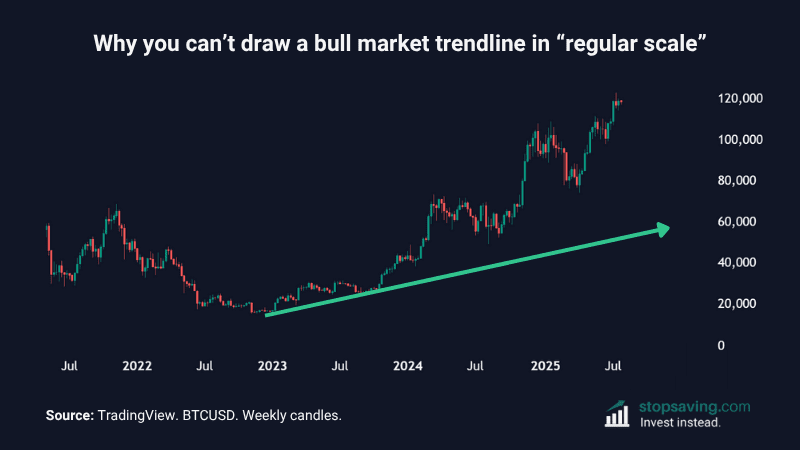
That’s why it’s better to use a logarithmic trendline to gauge the bitcoin trend during a bull market. By using log scale, we’re watching how the percentage moves change over time, rather than the price moves. This approach helps you spot trend strength, momentum shifts, and potential bull run support zones more clearly.
How to use the logarithmic trendline with bitcoin
As long as bitcoin holds the trendline, the bitcoin trend is still rising at a similar trajectory in percentage terms. So if and when that trajectory changes (i.e., the trendline breaks), you might want to be cautious. But until then, the bitcoin trend is up.
And here’s how you could apply it to your trading or investment strategy to better manage risk. Buy bitcoin when it’s closer to the trendline – rather than when it’s too high above it. That way, you’re buying nearer to price support – and closer to your exit point if bitcoin crosses the line.
As usual, none of this is investment advice. If you’d like to draw and track this trendline yourself in TradingView, grab our free PDF guide below to learn how:



