Are We In a Stock Market Bubble? (3 Warning Signs to Watch)
Stocks are at all-time highs, Big Tech is booming, and Nvidia is worth more than entire countries. So the obvious question is: are we in a stock market bubble? This post breaks it down simply. We’ll explain what a bubble actually is, and then check three warning signs to see if we’re in one today.
What is a stock market bubble?
A stock market bubble happens when stock prices rise way above their “fair” values. It usually follows this five-step pattern:
- A new idea (like AI or the internet) gets the market excited.
- Prices rise fast as early investors pile in.
- Media hype and FOMO (fear of missing out) bring in the crowds.
- Valuations disconnect from fundamentals, as euphoric investors dial up the leverage.
- Then something breaks. The bubble “pops” – and stock prices deflate.
Not every rally is a bubble, but market cycles often end with them. When you see hype, leverage, and prices going vertical for no apparent reason – it’s worth paying attention.
Past stock market bubble examples
Here are a few famous stock market bubbles that show how prices got out of hand – and what happened after.
Dotcom bubble (1995–2002): Investors went mad for anything with “.com” in the name. Pets.com, for example, spent over $1 million on a single Super Bowl ad – despite barely selling anything. Its stock crashed from $11 to 19 cents in under a year. The Nasdaq rallied over 1,000% from 1995 to 2000, then fell 83.5% by 2002.

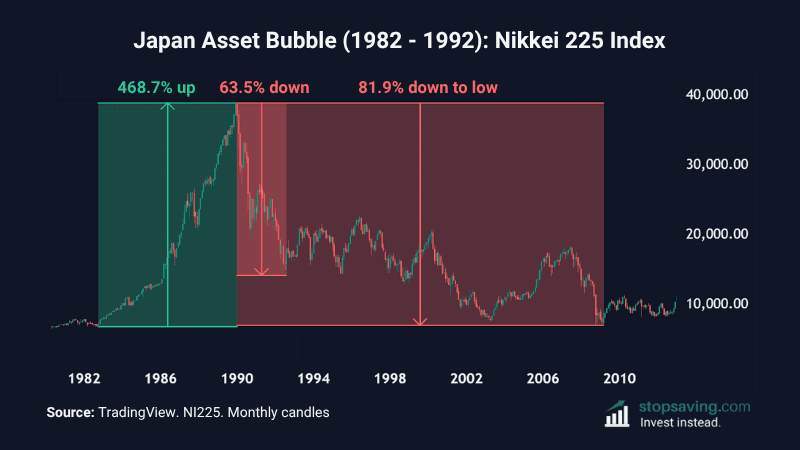
Japan’s asset bubble (1982–1992): At its peak, Tokyo real estate was worth more than all the land in the US – combined. Japan’s Nikkei 225 stock index surged by over 450% from 1982 to 1989. Loose monetary policy and speculation blew up the bubble. Then it burst in 1990. The index dropped 63.6% by 1992 – and eventually bottomed 82% lower in 2009.
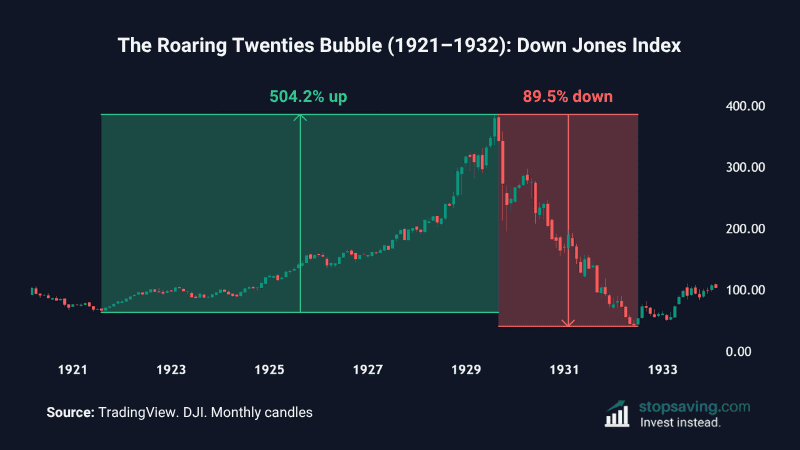
Roaring Twenties bubble (1921–1932): The Dow Jones index pumped nearly sixfold as post-war optimism and new tech (like radios and cars) drove a buying frenzy. “Margin debt” exploded – ordinary investors could buy stocks with just 10% money down. When the party ended in 1929, the US stock market crashed nearly 90%. Then came the Great Depression.
Bernard Baruch famously shorted stocks (bet against them) before the 1929 crash. Here’s how he described the scene before it: “Taxi drivers told you what to buy. The shoeshine boy could give you a summary of the day’s financial news as he worked with rag and polish.”
Everyone’s an investment guru in a bubble.
Are stocks in a bubble now?
To decide whether we’re in a stock market bubble, we can track three factors: stock market value, margin debt, and investor sentiment. Let’s unpack each of those points below:
1. Stock market value
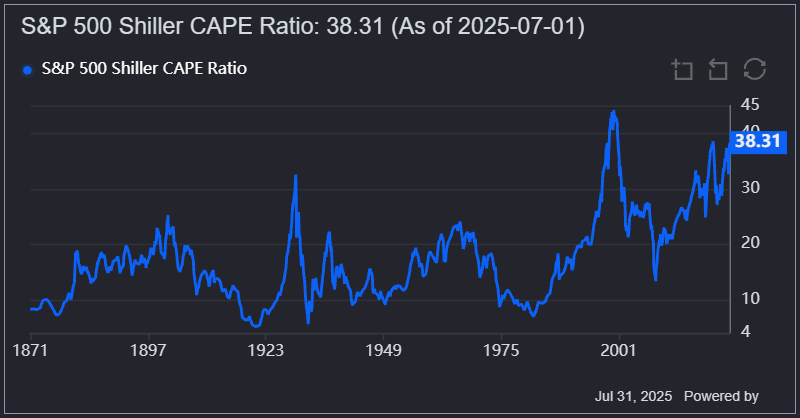
The Shiller CAPE ratio stands for Cyclically Adjusted Price-to-Earnings. It compares today’s stock prices to average company earnings over the past 10 years (adjusted for inflation). This smooths out short-term profit distortions to get a better sense of long-term stock values.
Right now, the CAPE ratio for the S&P 500 is about 38. That’s the third-highest reading in history, behind only the dot-com bubble and 1929 blow-off top. The long-term average is about 17. So, stocks today are more than twice as expensive as usual by this measure.
Note: you can track the latest Shiller CAPE ratio in the live chart below. This updates regularly, so it might not be 38 when you read this.
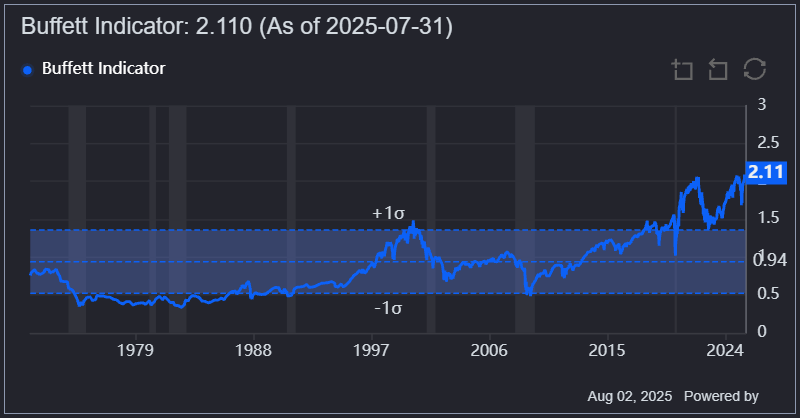
Then there’s the Buffett Indicator. This compares the total US stock market value (Wilshire 5000 Index) to the size of the US economy (Gross National Product). The higher the number, the more expensive US stocks look compared to actual economic output. The ratio is now hovering at 2.11 – the highest level ever recorded (based on post-World War II data).
You can also track the Buffett Indicator in the live chart below to see how the ratio changes.
So yes, stocks are expensive – which could be a sign we’re in a bubble. While that alone doesn’t cause a crash, it can make things worse if sentiment turns. Stocks can dip a long way before they get “cheap” again.
2. Margin debt
Here’s a risk that flies under the radar: margin debt. That’s money investors borrow to buy stocks. More margin means more risk. Because if stocks fall, those positions get liquidated (forced to close) quickly. And that can trigger even more stock selling.
As with any loan, margin investors pay interest for the privilege. But when stock prices stop rising, it becomes expensive to keep those leveraged positions open. So they might close them by selling their stocks.
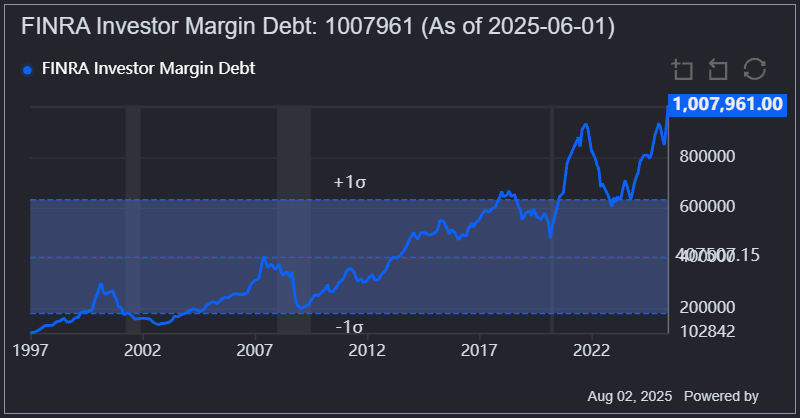
FINRA Investor Margin Debt tracks how much money US investors have borrowed from brokers to buy stocks on credit. It just hit a new all-time high of $1.008 trillion. That’s up 25% from last year. The last time we saw a spike like this was in late 2021 – the peak of the post-Covid bubble. You can track FINRA Investor Margin Debt live here:
3. Investor sentiment
The CNN Fear & Greed Index tracks how investors feel about the S&P 500 using seven data points. That includes price momentum, market breadth, volatility (via the VIX), options activity, and demand for safe-haven bonds.
It ranges from 0 (extreme fear) to 100 (extreme greed). Right now, it’s sitting near 50. That’s neutral (neither panicked nor greedy).
So while valuations and margin debt suggest we might be in a bubble, investor sentiment doesn’t. At least not yet. Still, two out of three ain’t bad.
What should you do if it is a stock market bubble?
No one rings a bell at the top, but warning signs are flashing. If we are in a stock market bubble, here are three things you can do to help protect your portfolio:
First, don’t buy stocks on margin. If things unravel, you’ll be licking your wounds. Remember, leverage works both ways. It boosts gains when markets rise – but magnifies losses on the way down. In a bubble, that can wipe you out fast.
Second, keep some cash on the sidelines. You don’t have to sell everything, but having dry powder gives you options. If stocks head lower, you’ll be ready to buy at better prices – and better risk-to-reward.
Third, diversify into unloved assets. If stocks are stretched, look at cheaper areas of the market. For example, long-dated US Treasury bonds.
Key takeaways
- Stock prices are historically expensive, with valuation ratios near dot-com levels – a classic bubble warning sign.
- Margin debt has hit record highs again, increasing the risk of forced selling if markets turn.
- Investor sentiment isn’t euphoric yet, but if it shifts, all three bubble ingredients could be in place.
As usual, none of this is investment advice. If you liked this analysis, check out my free newsletter for how-to guides and investment insights across crypto, stocks, metals, and more.