

Should You Buy The Coinbase Dip? COIN Technical Analysis
Coinbase stock (COIN) rallied 15% last week – completely erasing its drop from earlier this month. Here’s what I’m seeing in COIN’s price chart right now from a technical analysis perspective.
Video version of this post
COIN is in a long-term uptrend
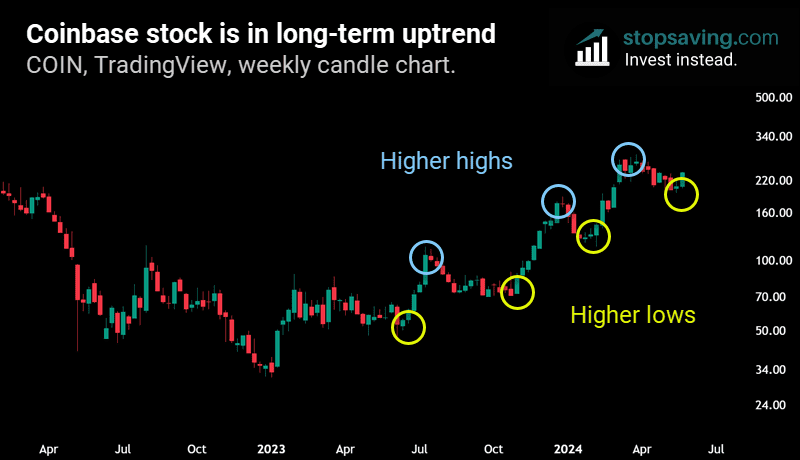
Each red or green candle in the chart below represents one week of price movement for COIN. We’re focusing on weekly candlestick charts here to track the stock’s long-term price movements – rather than stress about short-term noise. As you can see, the stock is in a clear uptrend, with higher highs (blue) and higher lows (yellow). Uptrends tend to continue more often than not.
Price support at the 20-week moving average
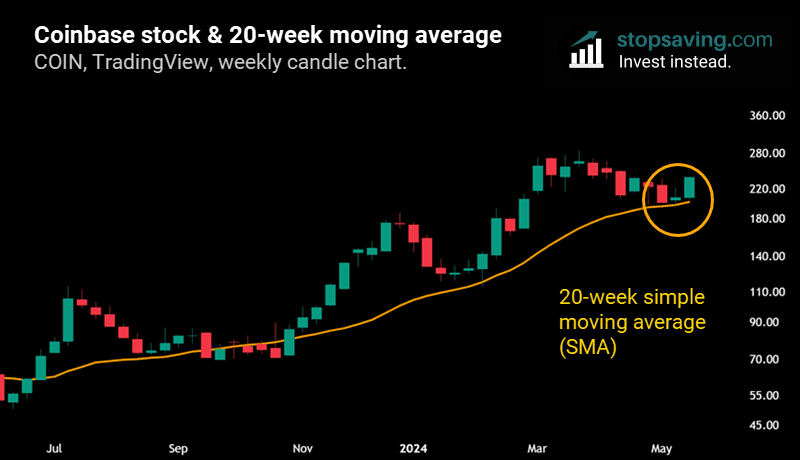
COIN has bounced nicely off its 20-week simple moving average (SMA, orange line, chart below), now acting as price support. The 20-week SMA line shows COIN’s average closing price over the past 20 weeks. It updates each week – ignoring intra-week price swings to give a clearer view of the trend. It’s sloping upward, too, which shows general strength in the uptrend. So long as it keeps sloping up and COIN’s price stays above it (on a weekly closing basis), the path of least resistance is higher for the stock.
Hidden bullish divergence
There’s hidden bullish divergence between the price of COIN and its relative strength index (RSI, blue). Here, the RSI divides the average gain of “up weeks” by the average loss of “down weeks” over the past 14 weeks. Notice how the RSI has trended down this year, meaning the average weekly losses are getting bigger than the average gains. In other words, selling pressure is getting relatively stronger than buying pressure, according to the indicator.

But despite that, the price of COIN just made a higher low. Sellers haven’t forced the price down, even though they’ve tried their best. Last week’s price candle closed above the high of the candle before it. That means a low has been “confirmed” (hence confirming the hidden bullish divergence). If you’re going strictly by the technical analysis book, that’s often a “buy the dip” signal. Just keep in mind that this would be a long-term signal – so there could still be short-term volatility.
Is Coinbase stock (COIN) a buy right now?
Technically speaking, COIN could have more room to run over the coming weeks and months. It’s clearly in a weekly uptrend, with its 20-week SMA acting as price support. And the RSI hidden bullish divergence adds to that view. The COIN chart looks bullish, but I’d get less bullish with a weekly close below $200. That’s a nice round number, and would put the stock back below its 20-week moving average.
Fundamentally, I’m happy to hold COIN for the long run because its business model makes sense. It’s the world’s most compliant crypto exchange, and crypto is here to stay.
The usual disclaimer: none of this is investing advice – it’s just my interpretation of a price chart, and that can change at any time. If you’d like more of my interpretations, sign up for our newsletter below.


