Sell in May vs Buy and Hold – What the Data Says
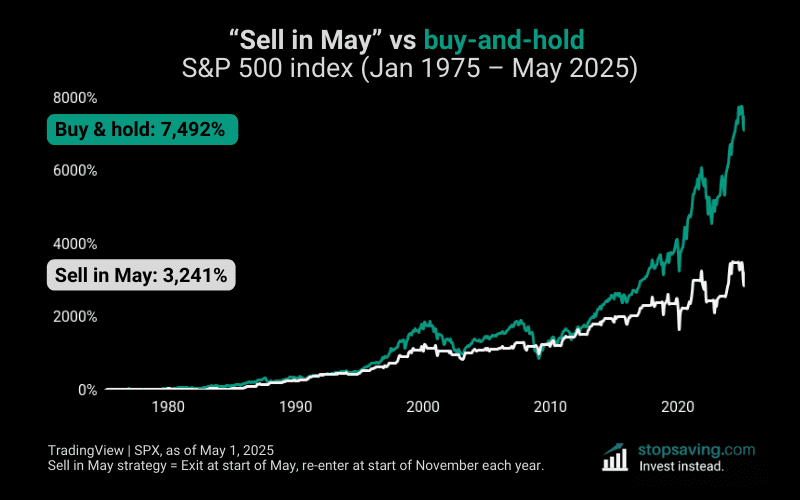
"Sell in May and go away" is one of the oldest seasonal strategies in investing. Here’s what the data says over the past 50, and 25 years....
READ MORE
 Stopsaving.com
"Sell in May and go away" is one of the oldest seasonal strategies in investing. Here’s what the data says over the past 50, and 25 years....
READ MORE
This chart tracks the value of $100 invested in gold vs silver since 1975. Over the past 50 years, gold has more than doubled silver....
READ MORE
Tesla bounced right off the 61.8% Fibonacci retracement level, despite reporting weak Q1 2025 earnings on Tuesday....
READ MORE
Gold’s run in 2025 has (so far) mirrored a steady slide in the dollar. Gold is up about 26%, while the US dollar index (DXY) is down 8.5%....
READ MORE
If bitcoin has already peaked for this market cycle, you can naturally expect a bear market. In that case, the chart below shows some potential downside targets using Fibonacci retracement levels. The...
READ MORE
The US Dollar Index (DXY) is forming a classic support/resistance (S/R) flip. Here’s why it matters for the markets....
READ MORE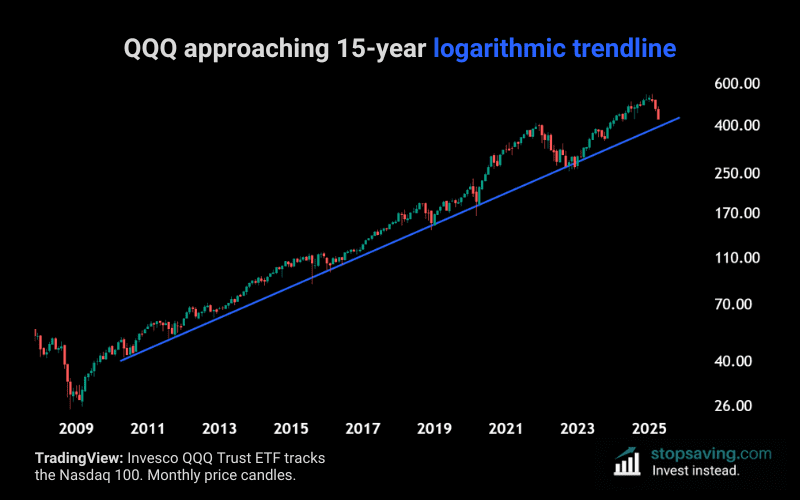
The Invesco QQQ ETF (QQQ) tracks the Nasdaq 100 – the go-to index for big tech growth stocks. Since 2010, the upward trendline in blue has supported QQQ’s price – and it’s now getting close to...
READ MORE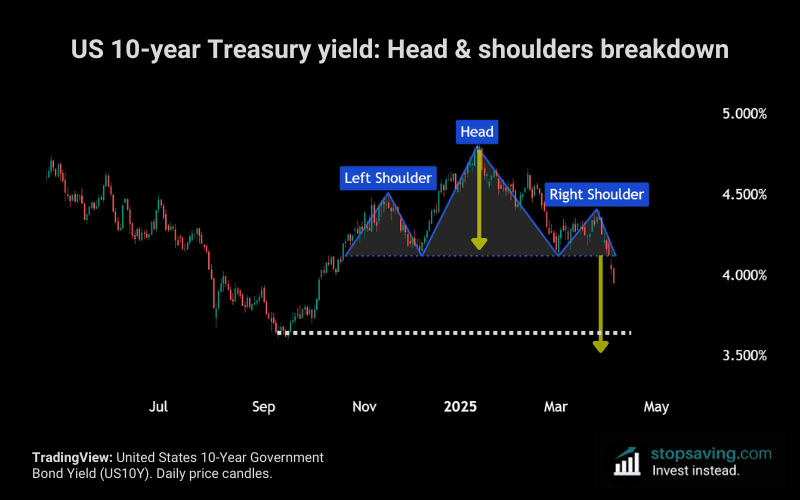
The US 10-year Treasury yield just dipped below 4%for the first time in months after breaking down from a textbook head and shoulders pattern....
READ MORE
The Stochastic RSI takes the regular RSI a step further. Instead of looking at price momentum, it looks at the momentum of RSI itself. This guide explains what the Stochastic RSI is, how it works, and...
READ MORE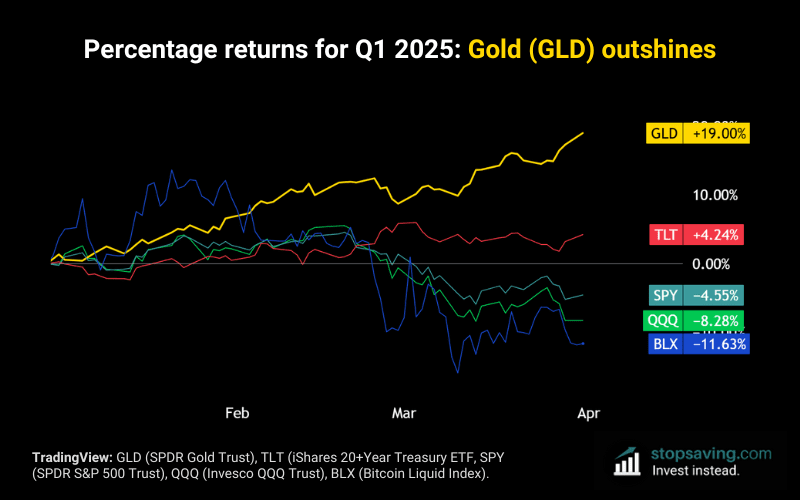
The "own gold and hope it doesn't go up" insurance policy paid off in the first quarter of 2025. Gold beat stocks, bonds, and bitcoin....
READ MORE